
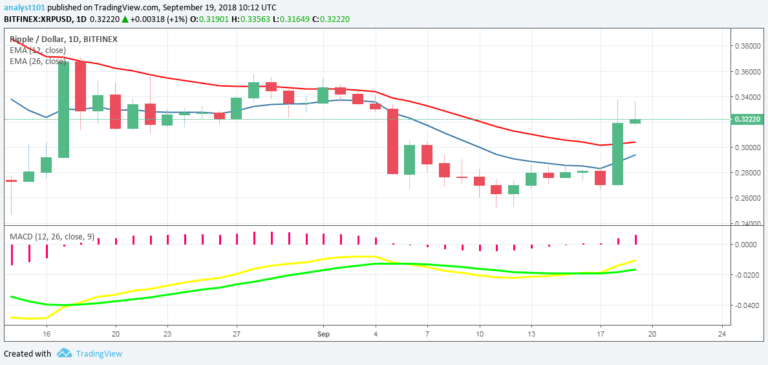

XRPUSD Medium-term Trend: Ranging
Resistance Levels: $0.34, $0.36, $ 0.38
Support Levels: $0.30, $0.28, $0.26
XRP’s price was in a bullish trend yesterday. The presence of more buyers than sellers at the $0.27 mark could’ve been behind a sudden bullish movement it saw, which led it to $0.34. The cryptocurrency had been hovering around the $0.27 mark before breaking it. With this, XRP is now out of the range bound zone at the $0.26-$0.28 zone.
XRP is now in its previous range bound zone, between $0.36-$0.30. Its price is currently fluctuating above the $0.32 price level which is a new support. Traders should look out for buy setups to initiate long trades. Nevertheless, the price is above the 12-day EMA and the 26-day EMA which indicates a bullish trend is ongoing. The MACD and signal lines are below the zero line which indicates a sell signal.
XRPUSD Short-term Trend: Bullish

On the 4-hour chart, the price of XRP is in a bullish trend. The price is above the 12-day EMA and the 26-day EMA which indicates the bullish trend is ongoing . The Relative Strength Index period 14 is level 69 which indicates that price is in the bullish trend zone.
The views and opinions expressed here do not reflect that of CryptoGlobe.com and do not constitute financial advice. Always do your own research.


