

XRPUSD Medium-term Trend: Ranging
Resistance Levels: $0.29, $0.31, $ 0.33
Support Levels: $0.26, $0.24, $0.22
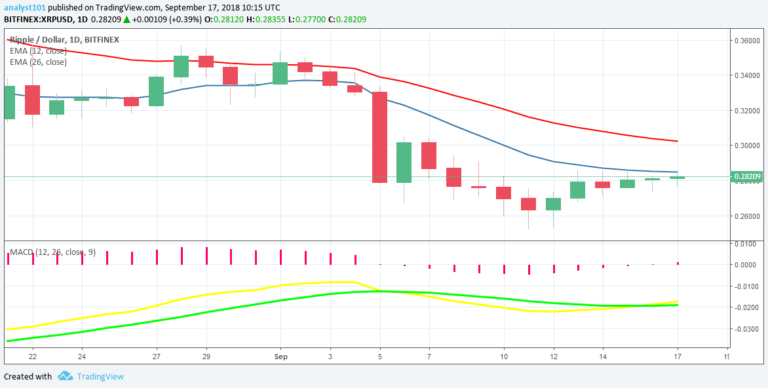
Last week, the XRP price had been in a range bound movement. The cryptocurrency had been facing resistance at the price of $0.27. On September 13th, the bulls broke the resistance level, and price has been sustained above the $0.27 price level for the past five days. The XRP price is likely to test the next resistance level at $0.30 because the price is nearing the bullish trend zone.
However, if price fails to reach the resistance level at $ 0.30; it will continue its range bound movement. The price is below 12-day EMA and 26-day EMA which indicates that the bearish trend is ongoing. The MACD line and the signal line are below the zero line which indicates a sell signal.
XRPUSD Short-term Trend: Ranging
 XRP Chart By Trading View
On the 4-hour chart, the price of XRP is in a range-bound movement. The XRP price is ranging horizontally at a price of $0.28. The price is above the 12-day EMA and 26-day EMA which indicates that the bullish trend ls ongoing. Nevertheless, the Relative Strength Index period 14 is level 55 which indicates that the price is in the sideways trend.
The views and opinions expressed here do not reflect that of CryptoGlobe.com and do not constitute financial advice. Always do your own research.


