
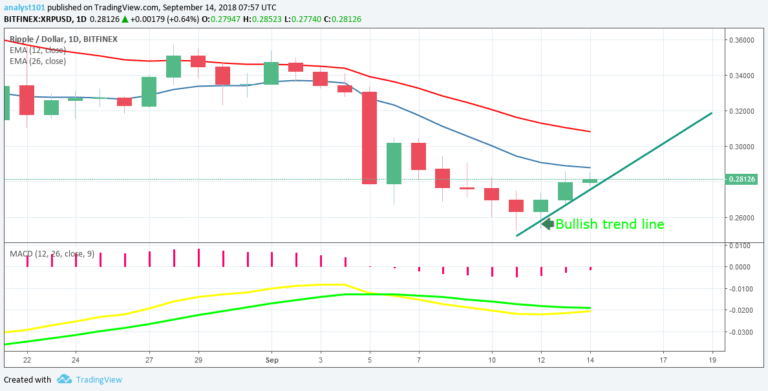

XRPUSD Medium-term Trend: Bullish
Resistance Levels: $0.29, $0.31, $0.33
Support Levels: $0.26, $0.24, $0.22
Yesterday, the XRP price was in a bullish trend. Today, the bulls are likely to break the resistance level at $0.27 as price fluctuates around the price of $0.28. Meanwhile, a bullish trend line is drawn to determine the length of the bullish trend. At the lower time frame if a candlestick tests the trend line and bounces back a long trade should be initiated.
If the price breaks the trend line and the candlestick closes on the opposite of the trend line, this indicates that the bullish trend has ended. Meanwhile, the price is likely to face resistance at the $0.30 price level. Nevertheless, the price is below 12-day EMA and 26-day EMA which indicates that the bearish trend is ongoing.The MACD line and the signal line are below the zero line which indicates a sell signal.
XRPUSD Short-term Trend: Bullish

On the 4-hour chart, the price of XRP is in a bullish trend. The XRP price is making a series of higher highs and high lows. On the chart, the next candlestick on the trend line will determine the progress of the bullish trend. Nevertheless, the Relative Strength Index period 14 is level 55 which indicates that price is in the sideways trend.
The views and opinions expressed here do not reflect that of CryptoGlobe.com and do not constitute financial advice. Always do your own research.


