

XRPUSD Medium-term Trend: Bearish
Supply levels: $0.35, $0.37, $ 0.39
Demand levels: $0.26, $0.24, $0.22
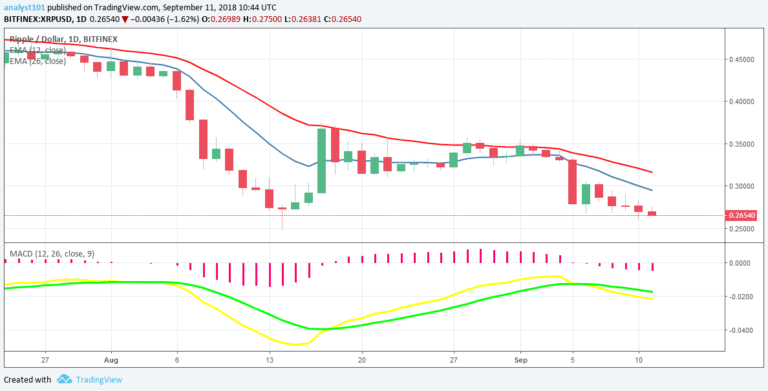
The XRP price was in a bearish trend yesterday the cryptocurrency fell to the low of $0.27. Today, XRP price will likely continue its downward trend. Presently, the bearish candlestick is approaching the $0.26 price level. The cryptocurrency is heading to reach the next support level at $0.24. You can see that the price is below 12-day EMA and 26-day EMA which indicates that the bearish trend is ongoing.
The MACD indicator gives a sell signal because the MACD line and the signal line are below the zero line. Traders should wait for the price to reach the next support level or the bearish pressure exhausted before initiating any trade. Stop losses are necessary to protect against sudden breakouts and should be placed below the support level.
XRPUSD Short-term Trend: Bearish

On the 4-hour chart, the price of XRP is in a downward trend. The XRP price is making a series of lower highs and lower lows. If the downward trend continued the demand levels would be breached. The Relative Strength Index period 14 is level 33 which indicates that the market is oversold suggesting bulls to take control of the market.
The views and opinions expressed here do not reflect that of CryptoGlobe.com and do not constitute financial advice. Always do your own research.


