
XRPUSD Long-term Trend – Bearish
Distribution territories: $0.50, $0.60, $70.
Accumulation territories: $0.20, $0.15, $0.10.
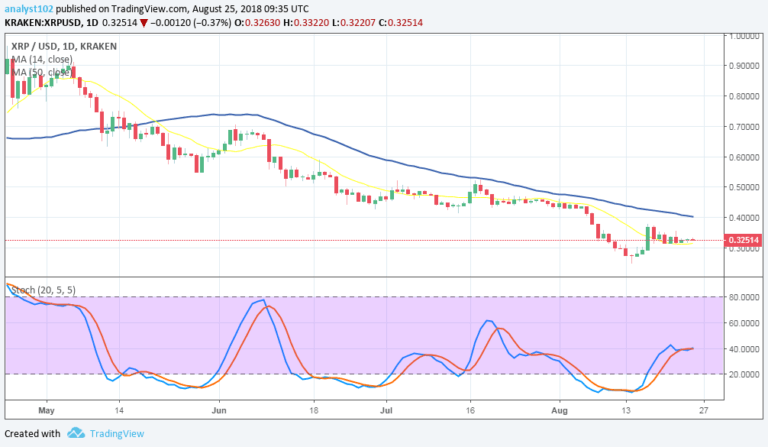
The XRPUSD trading pair has been in a range-bound movement for over a week. On September 5, the cryptocurrency saw its value drop considerable against the US dollar, to the point its price got to $0.27. XRP has now been trading at the low price regions it saw on August 11 and 16, between the territories of $0.3 and $0.25. The 14-day SMA is below the 50-day SMA. XRP Chart by TradingView
The cryptocurrency has been trading below the two SMAs. The Stochastic Oscillators are now below range 80 and moved to the ranges of 60 and 40. They still point south towards range 20. This shows the cryptocurrency may still go further south. Some indicators show XRP may soon see a series of lower lows and lower highs below the 14-day SMA’s trendline.
The cryptocurrency has been under heavy selling pressure while the 50-day SMA hasn’t been intersected by the 14-day SMA. Investors can continue to buy the cryptocurrency while it dips but traders should watch out for a bearish reversal to enter a long position.
The views and opinions expressed here do not reflect that of CryptoGlobe.com and do not constitute financial advice. Always do your own research.


