
 Litecoin Chart by Trading View
LTCUSD Medium-term Trend: Ranging
Resistance Levels: $60, $62, $64
Support Levels: $55, $53, $51
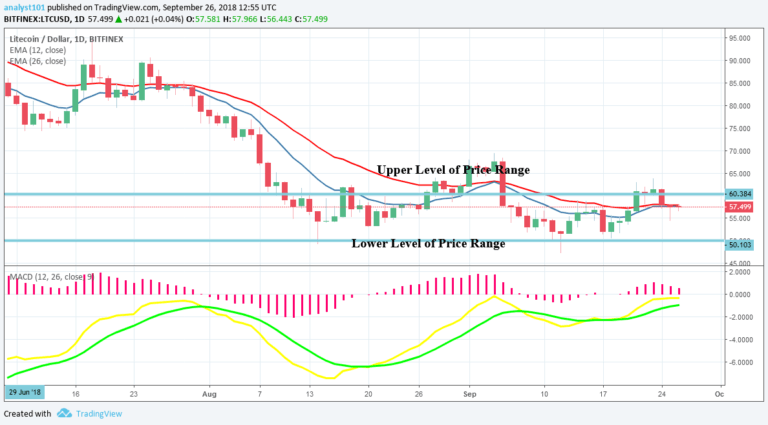
The LTCUSD pair had been range bound between the levels of $50 and $60 since September 5, 2018. Yesterday, it was bearish because the upper level of price range was resisted on September 23. Today, the price of Litecoin is bullish but is ranging at a price of $57. Traders should know that in a ranging market you can trade the upper and lower levels of the price range.
If the current bullish trend tests the upper level of the price range and bounces back, you can initiate a short trade and a stop loss order above the $60 price level. You can exit your short trade at the support zone. At the lower level of the price range, you can initiate a long trade and a stop loss order below the $50 price level. You can exit your long trade near the resistance zone.
Nevertheless, the LTC price is above the 12-day EMA and 26-day EMA which indicates that a bullish trend is continuing. The MACD line and Signal line are below the zero line which indicates a sell signal.
LTCUSD Short-term Trend: Bullish
 Litecoin Chart by Trading View
On the 4-hour chart, the LTC price is in a bullish trend. The price is approaching the upper level of the price range. The price of Litecoin is neither above nor below the 12-day EMA and 26-day EMA which indicates that the price is in the sideways trend zone.
The views and opinions expressed here do not reflect that of CryptoGlobe.com and do not constitute financial advice. Always do your own research.


