

LTCUSD Medium-term Trend: Ranging
Resistance Levels: $60, $62, $64.
Support Levels: $56, $54, $52
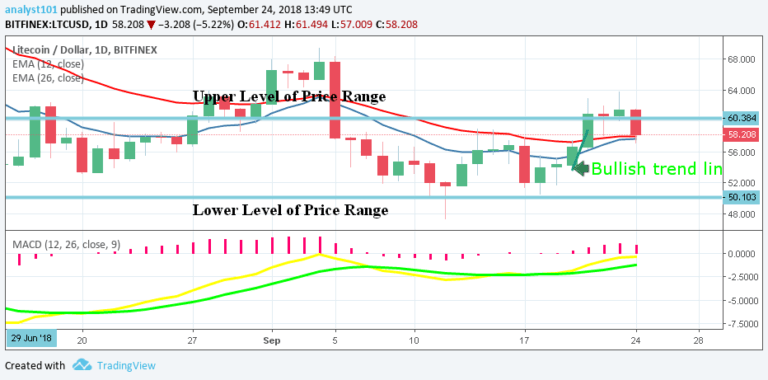
Last week the price of Litecoin had been range bound between the levels of $50 and $60. On September 18, the cryptocurrency commenced a bullish movement at a price of $51.14 which reached the high of $61.80. This was resisted at the upper level of price range.
The MACD line and the signal line are at par with the zero line which indicates a neutral signal. Also, the price of Litecoin is above the 12-day EMA and the 26-day EMA which indicates that price is in the bullish trend zone.
LTCUSD Short-term Trend: Ranging

On the 4-hour chart, the LTC price is in a sideways trend. The LTC price shows the upper level of price range where price was resisted twice and it is approaching the price at $58. Meanwhile, the Relative Strength Index period 14 is level 48 which indicates that price is in the sideways trend zone.
The views and opinions expressed here do not reflect that of CryptoGlobe.com and do not constitute financial advice. Always do your own research.


