
 Litecoin Chart By Trading View
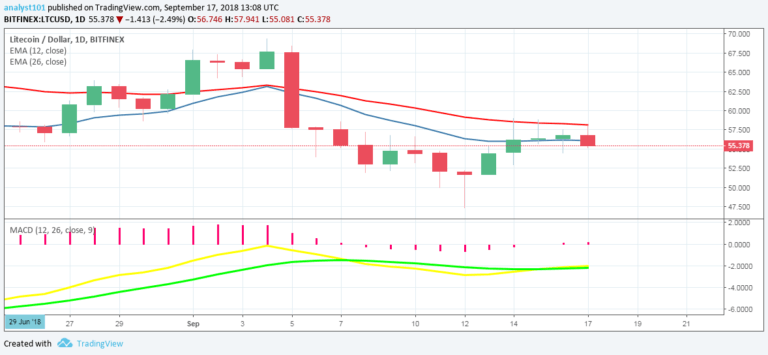
LTCUSD Medium-term Trend: Ranging
Resistance Levels: $60, $65, $70
Support Levels: $50, $45, $40
Last week the price of Litecoin was in a bullish trend. The LTC price resumed its range bound movement between the levels of $60 and $50. On September 11th, the cryptocurrency reached its low at $49.84 and commenced a bullish movement. On September 14th, the price reached the upper level of a price range of $58.89 and was resisted. The price is now falling towards the lower level of a price range.
Since the upper level of price was not broken, that should have been an opportunity to initiate a short trade. Therefore, traders can look out to initiate a long trade at the lower level of price, if the price falls to break the lower level of a price range. The LTC price is below the 12-day EMA and 26-day EMA which indicates that a bearish trend is continuing.
The MACD line and Signal line are below the zero line which indicates a sell signal.
LTCUSD Short-term Trend: Bearish
 Litecoin Chart by Trading View
On the 4-hour chart, the LTC price is in a downward trend. The price of Litecoin fell after reaching the upper level of price .The price is below the 12-day EMA and 26-day EMA which indicates that the price is falling. Meanwhile, the Relative Strength Index period 14 is level 47 which indicates that the market is oversold suggesting bulls will take control of the market.
The views and opinions expressed here do not reflect that of CryptoGlobe.com and do not constitute financial advice. Always do your own research.


