
 Litecoin Chart by Trading View
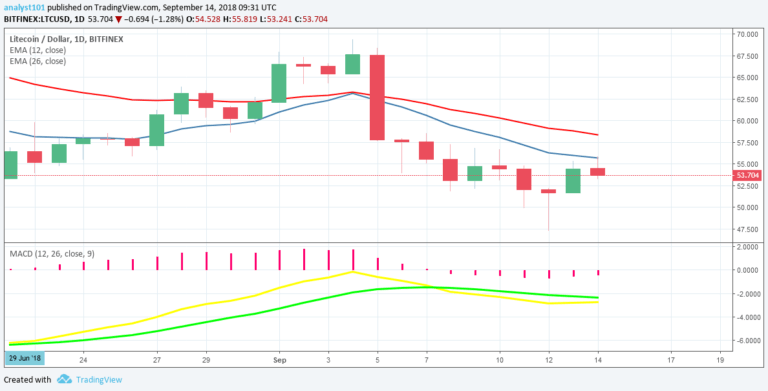
LTCUSD Medium-term Trend: Bearish
Resistance Levels: $55, $57, $59
Support Levels: $53, $51, $49
Yesterday, the price of Litecoin was in a bullish trend. The cryptocurrency is facing resistance at a price of $55. Yesterday, the LTC price reached the high of $55.28 and was resisted then the price fell and closed at $53.81.
The price is approaching the previous low of $52.74. Today, the price of Litecoin is likely to fluctuate between the levels of $55 and $ 50. The LTC price is below the 12-day EMA and 26-day EMA which indicates that a bearish trend is continuing. The MACD line and Signal line are below the zero line which indicates a sell signal.
LTCUSD Short-term Trend: Bearish
 Litecoin Chart by Trading View
On the 4-hour chart, the LTC price is in a downward trend. Today, the price of Litecoin reached the high of $55.67 and the price is in a downward trend again. The price is below 12-day EMA and 26-day EMA which indicates that the price is falling. Meanwhile, the Relative Strength Index period 14 is level 49 which indicates that price is in the sideways trend zone.
The views and opinions expressed here do not reflect that of CryptoGlobe.com and do not constitute financial advice. Always do your own research.


