
 Litecoin Chart by Trading View
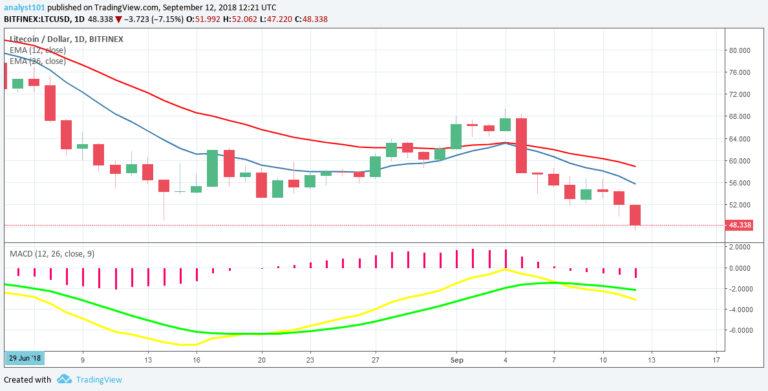
LTCUSD Medium-term Trend: Bearish
Resistance Levels: $50, $52, $54
Support Levels: $46, $44, $42
Yesterday, the price of Litecoin was in a downward trend. Litecoin has fallen out of the range bound zone between $50 and $60, the next support level that is currently being tested is $46. However the 12-day EMA and 26-day EMA which indicates that a bearish trend is continuing. Also the MACD line and Signal line are below the zero line which indicates a sell signal.
LTCUSD Short-term Trend: Bearish
 Litecoin Chart by Trading View
On the 4-hour chart, the LTC price is in a bearish trend. Price of Litecoin is below the 12-day EMA and 26-day EMA which indicates that price is falling. Meanwhile, the Relative Strength Index period 14 is level 28 which indicates that the market is oversold suggesting bulls to take control of the market.
The views and opinions expressed here do not reflect that of CryptoGlobe.com and do not constitute financial advice. Always do your own research.


