
LTCUSD Long-term Trend – Ranging
Distribution territories: $100, $120, $140.
Accumulation territories: $40, $30, $10.
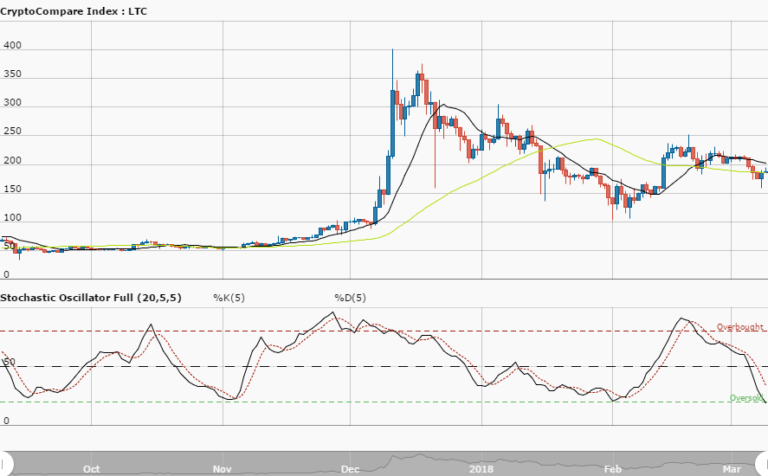
Litecoin has been seeing lower lows and lower highs in its trading sessions since September 6. On September 5, a strong bearish candlestick weakened the cryptocurrency and led to its current low. It’s now ranging between the territories of $60 and $50

On LTC’s chart, the $60 price line has been market by the 50-day SMA’s trendline. It’s located above the 14-day SMA. Stochastic Oscillators dipped into the oversold area and are now over range 20. This simply suggests the bulls are finding their way back into the market.
Some indicators point the cryptocurrency’s price may be reversed, however, and pushed southward towards the accumulation territory of $40. A safe bullish entry point seems to be around the $50 mark or a bit below. Traders can wait for a strong price action to enter a position.
The views and opinions expressed here do not reflect that of CryptoGlobe.com and do not constitute financial advice. Always do your own research.


