
LTCUSD Long-term Trend – Bearish
Distribution territories: $100, $120, $140.
Accumulation territories: $40, $30, $10.
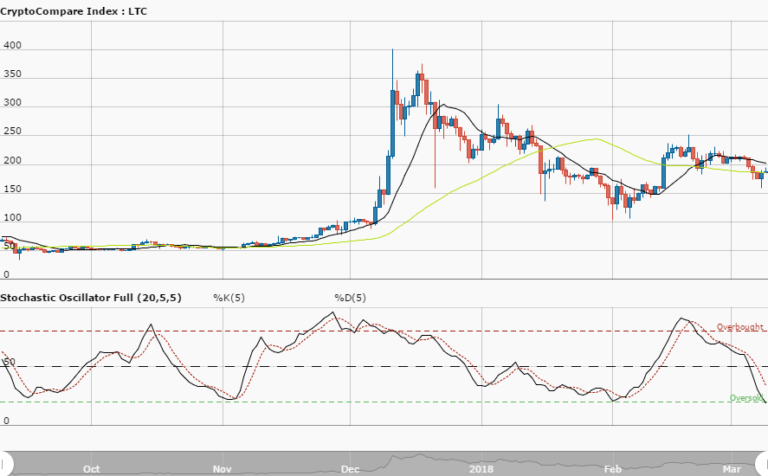
Last week, between August 26 and 31, Litecoin saw its price move in a range-bound zone. On September 1, the cryptocurrency saw its price rise to touch the 50-day SMA from below. This week it’s also been trading in ranging movements.

A bearish Japanese candlestick suddenly emerged under the 50-day SMA and pushed down the Litecoin’s price from around $67 to around $57. Its price has now been heading south towards $50, underneath the trendline of the 14-day SMA. The 50-day SMA is above the 14-day SMA.
The Stochastic Oscillators have convincingly crossed the overbought area, and now point south. Litecoin, given its current bearish trend, may see its price go down towards lows near the $40 or $35 marks. The bulls may still come back and help its price surge when it hits the $50 or $40 territories. Currently, investors should suspend Litecoin-related trades.
The movement could be in a manner of ranging, but bulls may have to come back while a reversal will re-feature between the territories of $50 and $40. For a while, investors should suspend buying into the crypto.
The views and opinions expressed here do not reflect that of CryptoGlobe.com and do not constitute financial advice. Always do your own research.


