Ethereum Price Medium-term Trend: Bearish
Supply zones: $400, $450, $500
Demand zones: $150, $100, $50
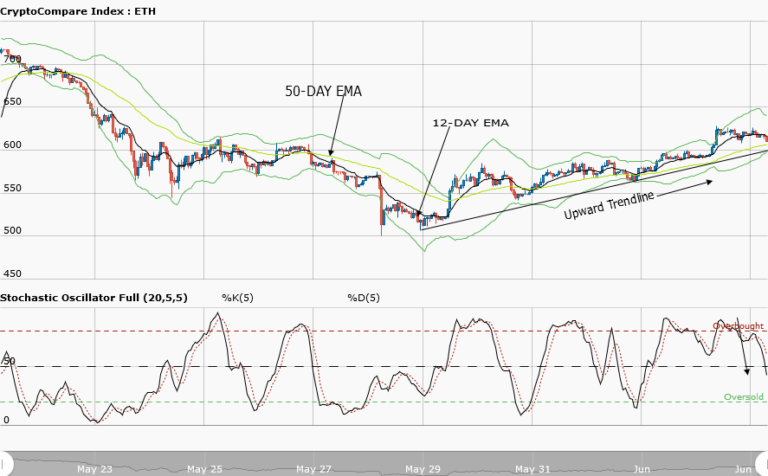
ETH remains in a bearish trend in the medium-term outlook. ETH was down to $185.12 in the demand area. This was a retest of the demand area from 31st July 2017 after a bullish railroad was formed on 17th July.
Retracement to $208.37 in the supply area by the bulls was short-lived as the bears returned. The 10-EMA is seen acting as a strong resistance to further upward movement.
The bears still remain in control and as more candles formed and closed below the 10-EMA, $150.00 in the demand area may be the bears’ target in the medium-term
Ethereum Price Short-term Trend: Bearish
ETH is in a bearish trend its short-term outlook. The strong bearish pressure broke the $211.29 resistance in the lower demand area of the range on 8th September. Price was further down to $185.15 in the demand area after retesting the broken lower demand area.
Exhaustion sets in as wicks were seen in the candle at the demand area which conversely implies gradual bulls return coupled with the bullish spinning top at the area.
The large bullish engulfing candle signalled the bulls return as the cryptocurrency made a high of $208.37 in the supply area on 9th September.
Price is around the 10-EMA and below the 50-EMA and indication of strong bears pressure and current bullish momentum may be a pullback for bearish trend continuation.
The views and opinions expressed here do not reflect that of CryptoGlobe.com and do not constitute financial advice. Always do your own research


