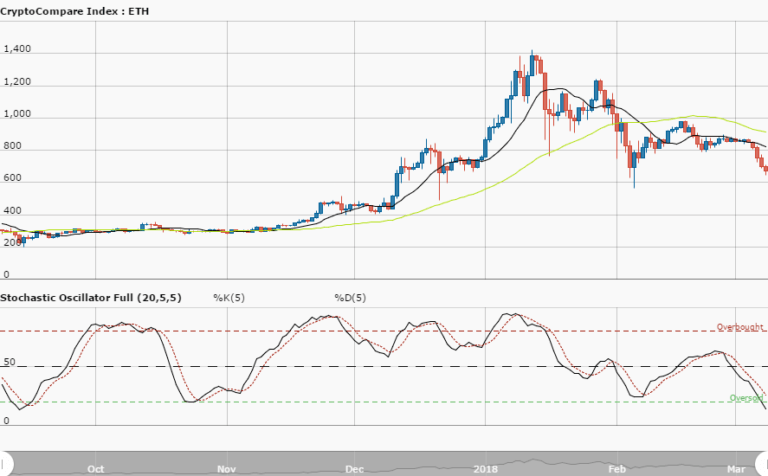
ETHUSD Long-term Trend – Bullish
Distribution territories: $400, $450, $500.
Accumulation territories: $150, $100, $50.
Ethereum’s pice has significantly dropped against the US dollar this past week. On September 9, the cryptocurrency kept forming various lower lows, until on September 12 it hit a new yearly low of $167.
On September 13, the cryptocurrency saw its price suddenly spike upwards, giving it the strength to briefly push past its 14-day SMA. Its price has now been averaging towards the $250 territory, around the 14-day SMA. There is still a notably gap between the 14 and 50-day SMA.
The Stochastic Oscillators have crossed from the overbought zone to move past range 20. They now point north to suggest an upward movement. There may now be a probability of seeing the cryptocurrency’s ranging movements go between the territory of $250 and its last lowest price of $167 in the next trading days.
We may see a bullish markt if the crypto convincingly surpasses $250 or see a strong reversal of the trend. Traders may wait for better action to enter the market.
The views and opinions expressed here do not reflect that of CryptoGlobe.com and do not constitute financial advice. Always do your own research.


