
ETHUSD Long-term Trend – Bearish
Distribution territories: $400, $450, $500.
Accumulation territories: $150, $100, $50.
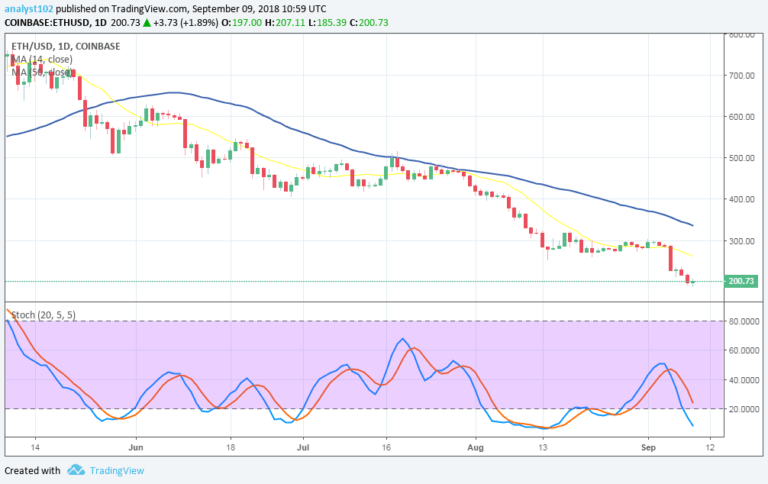
Taking a look at the price charts it’s possible to see that the ETHUSD pair was moving in a range-bound zone between August 20 and September 4. Ethereum has now breached the zone’s confinements marked by the distribution and accumulation territories of $300 and $270 southbound to a low price of $225, on Sept. 5.

Since then, the cryptocurrency has been seeing its price decline further. Currently, the cryptocurrency is trading a little above the $200 territory, although it saw a $185 low. It’s below the 14-day SMA’s trendline, which is located below the $300 mark. The 50-day SMA is located over the 14-day SMA with a distinct gap between them.
The stochastic Oscillators have now dipped into the oversold region. This indicates the bearish movements are not over. The force behind this bearish trend may see the dip get to a low that can reach $150 in the next few days. A strong reversal from the $200 mark could lead to a bullish movement. Traders are advised to be on the lookout for said reversal and enter a long position on it.
The views and opinions expressed here do not reflect that of CryptoGlobe.com and do not constitute financial advice. Always do your own research.


