
EOSUSD Long-term Trend – Bullish
Distribution territories: $15, $20, $25.
Accumulation territories: $4, $3, $2.
Last week, on August 26, EOS saw its price fall to a bearish move. In the following days, the cryptocurrency kept gaining value until September 1. EOS has now managed to touch the 50-day SMA’s trendline from below.

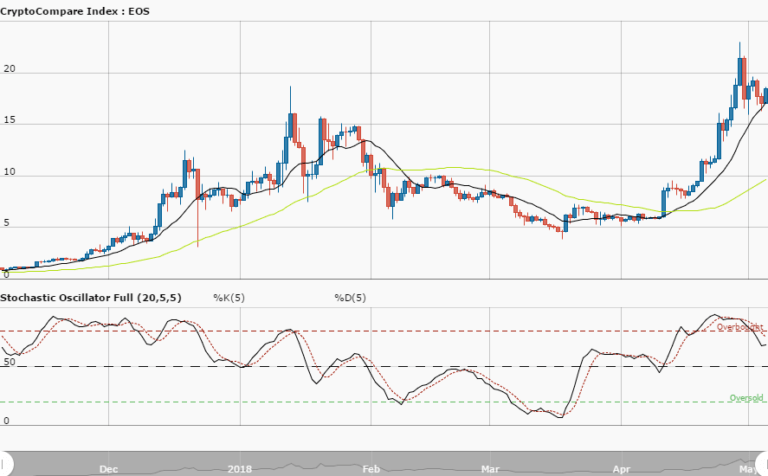
The cryptocurrency’s price has now pushed past a high Japanese bullish candlestick that emerged on August 17. It has been hovering around the 50-day SMA’s trendline, and the 14-day SMA is now bent northward pointing to the $6 territory. The 50-day SMA is still well above the 14-day SMA.
The Stochastic Oscillators have penetrated the overbought region. They now appear to point south. This means traders should be cautious when entering a position. There’s still evidence pointing towards this crypto seeing its price range between the $7.5 and $4 territories in the next few days.
EOS going below the $5 distribution territory will show the bears are still in control of the market. It’s assumed traders should look out for decent long position entry points with good financial principles in mind.
The views and opinions expressed here do not reflect that of CryptoGlobe.com and do not constitute financial advice. Always do your own research.


