

BTCUSD Medium-term Trend: Bearish
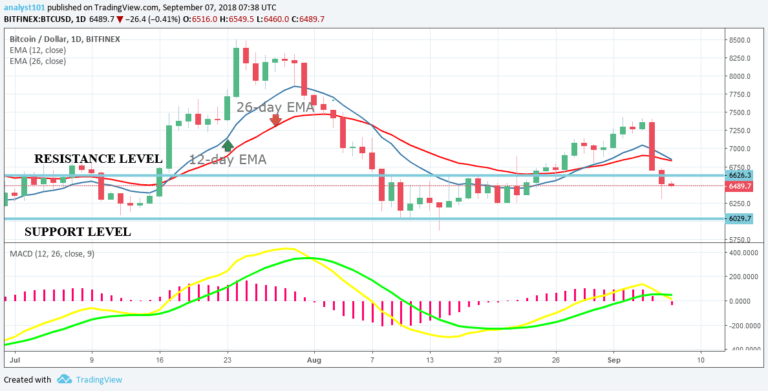
Resistance levels: $6,500, $6,700, $6,900
Support levels: $6,300, $6,100, $5,900
Yesterday, the BTCUSD pair fell into the previous range bound zone. The price fell to the low of $6,294.76 and commenced a range bound movement. If the price fluctuates between the levels, then we can trade the key levels of the zone.
Firstly, we have to wait for the price to test and bounce back before initiating any trade. What I mean is that if price tests the upper level, we will initiate a short trade and a stop loss above the upper level. We exit the short trade near the support level. Also, we initiate a long trade at the lower level and a stop loss below the lower level.
The long trade should be exited near the resistance level. The idea is to make partial profits during the time of price range. The stop loss is to manage a sudden breakout.
BTCUSD Short-term Trend: Ranging

From the 4-hour chart, the BTC price is range bound. The BTC price has commenced a range bound movement. Meanwhile, the Relative Strength Index period 14 is level 26 which indicates that the market is oversold suggesting bulls to take control of the market.
The views and opinions expressed here do not reflect that of CryptoGlobe.com and do not constitute financial advice. Always do your own research.


