

BTCUSD Medium-term Trend: Bullish
Resistance levels: $7,400, $7,600, $7,800
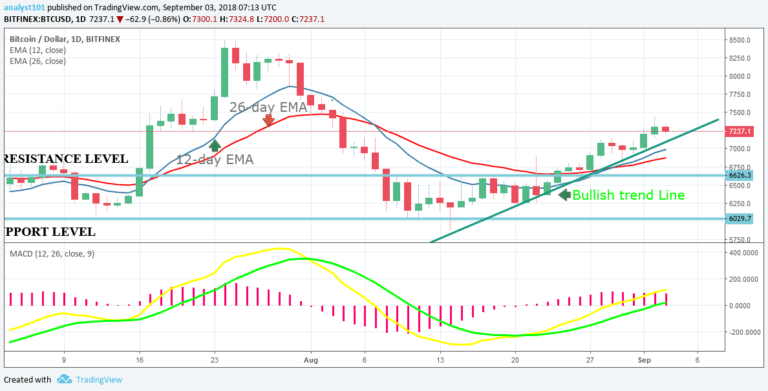
Support levels: $7,100, $6,900, $6,700
Last week the BTCUSD pair was in a bullish trend. On August 28th, the price of Bitcoin broke the $7,000 price level. On August 30th, the bears’ pulled back the price to the low of $6,800 and a range-bound movement commenced. However, on August 31st, the price of Bitcoin broke the $7,000 price level again and established above the critical level.
Today, the BTC price is in a bullish trend.On September 1st, the price tested the trend line and bounced back. This would have been an opportunity to initiate long trades and stop loss orders below the $7,000 price level. The $7,000 price level is holding because the bulls have held the price above the $7,000 price level after days of struggle.
The price is expected to reach the $8,500 price level, therefore as the price retraced and tested the trend line, it is a signal to initiate a long traded. Meanwhile, the MACD line and the signal line are above the zero line which indicates a buy signal. In addition, the price of bitcoin is above the 12-day EMA and the 26-day EMA which indicates that the BTC price was rising.
BTCUSD Short-term Trend: Bullish

From the 4-hour chart, the BTC price is in a bullish trend. The price bars are above the exponential moving averages indicating that the price is rising. Meanwhile, the Relative Strength Index period 14 is level 61 which indicates that price is in the bullish trend zone.
The views and opinions expressed here do not reflect that of CryptoGlobe.com and do not constitute financial advice. Always do your own research.


