

BTCUSD Medium-term Trend: Ranging
Resistance levels: $6,800, $7,000, $7,200
Support levels: $6,300, $6,100, $5,900
The price of Bitcoin is in a range bound movement in the last 48 hours. The BTC price is consolidating above the $6,400 price level. On September 25, the price of Bitcoin fell to the low of $6,395.65 and commenced a bullish movement. The bulls reached the high of $6,546.39 and were resisted by the bears. The BTC price is falling but presently it is fluctuating above the $6,400 price level.
The cryptocurrency is due for price breakout soon; either as a breakout to the downside or a breakout to the upside. If the price breaks the $6,400 price level; there are indications that it will reach the lower level of the price range which is the $6,200 price level. In addition, the critical support zone of $5,900-$6,075 would be threatened.
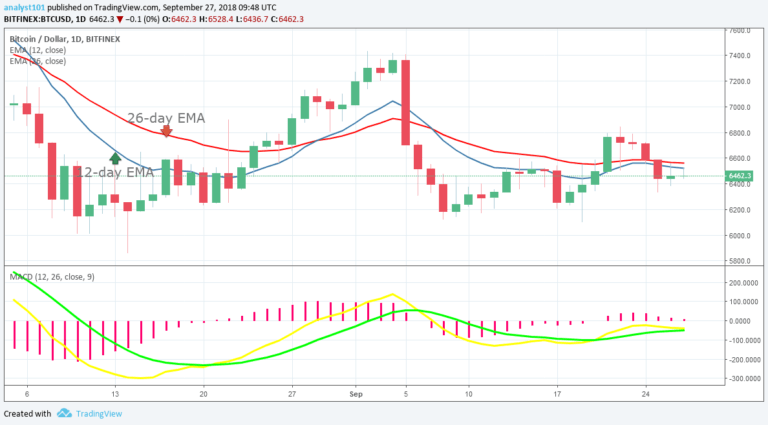
On the other hand, the price will rally if it breaks through the resistance at $6,580 and gathers momentum at $7,400. The MACD line and the signal line are at par with the zero line which indicates a neutral signal. The price of Bitcoin is below the 12-day EMA and 26-day EMA which indicates that a bearish trend is ongoing.
BTCUSD Short-term Trend: Ranging

On the 4-hour chart, the BTC price is in a sideways trend. The price of Bitcoin is neither below nor above the 12-day EMA and the 26-day EMA which indicates that the price is in the sideways trend zone. The Relative Strength Index period 14 is level 45 which indicates that the price is in the sideways trend zone.
The views and opinions expressed here do not reflect that of CryptoGlobe.com and do not constitute financial advice. Always do your own


