

BTCUSD Medium-term Trend: Ranging
Resistance levels: $6,800, $7,000, $7,200
Support levels: $6,500, $6,300, $6,100
Last week the BTC price was in a range bound movement. On September 17, the price of Bitcoin fell to the low of $6,211.45 and commenced a range bound movement. The cryptocurrency retraced to the low of $6,647.08 and commenced a range bound movement.
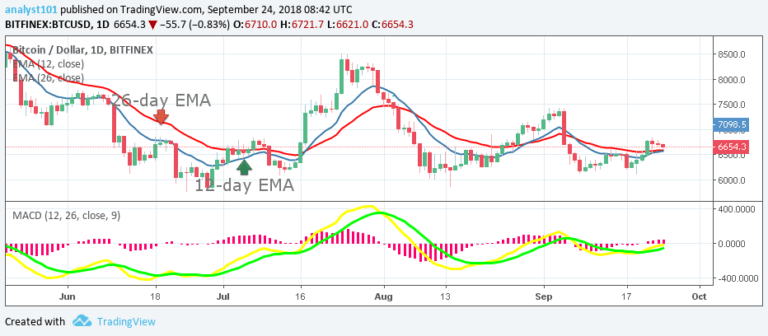
Today, the price of Bitcoin is likely to fall to its previous low of $6,415.68. However, if the price falls and breaks the $6,400 price level, the cryptocurrency will be range bound at the support zone and likely test the lower level of the range at $6,200. Meanwhile, the MACD line and the signal line are at par with the zero line which indicates a neutral signal.
Also, the price of Bitcoin is above the 12-day EMA and the 26-day EMA which indicates that the price is in a bullish trend.
BTCUSD Short-term Trend: Ranging

On the 4-hour chart, the BTC price is in a sideways trend. The price of Bitcoin fell from the high of $6,832.47 and it is currently in a range bound movement. Meanwhile, the Relative Strength Index period 14 is level 48 which indicates that price is in the range bound zone.
The views and opinions expressed here do not reflect that of CryptoGlobe.com and do not constitute financial advice. Always do your own research.


