

BTCUSD Medium-term Trend: Bullish
Resistance levels: $6,800, $7,000, $7,200
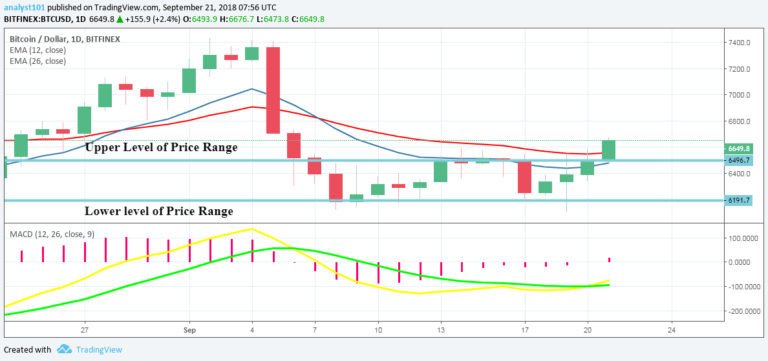
Support levels: $6,500, $6,300, $6,100
The BTCUSD pair was in a bullish trend yesterday. The bullish trend is continuing as the price makes a series of higher highs and higher lows. The price of Bitcoin is out of the range-bound zone as a result of the bullish trend. A bullish trend line is drawn at the lower time frame showing the support levels of the price.
A trader can initiate a long trade as soon as price tests the trend line and bounces back. This could be done as long as the bullish trend lasts. However, if the trend line is broken and the candlestick closes on the opposite of the trend line; then the trend is assumed to be over. Meanwhile, the BTC price eyes the $7,400 price level.
If the bulls overcome the $7,400, the cryptocurrency will attain the highs of $8,000 and $8,500 . Nevertheless, the MACD line and the signal line are below the zero line which indicates a sell signal. The price of Bitcoin is above the 12-day EMA and 26-day EMA which indicates that a bullish trend is ongoing.
BTCUSD Short-term Trend: Bullish

On the 4-hour chart, the BTC price is in a smooth uptrend. A trend line showing support levels of price where traders can initiate their long trades. Meanwhile, the Relative Strength Index period 14 is level 72 which indicates that the price is in the bullish trend zone.
The views and opinions expressed here do not reflect that of CryptoGlobe.com and do not constitute financial advice. Always do your own research.


