

BTCUSD Medium-term Trend: Ranging
Resistance levels: $6,500, $6,700, $6,900
Support levels: $6,200, $6,000, $5,800
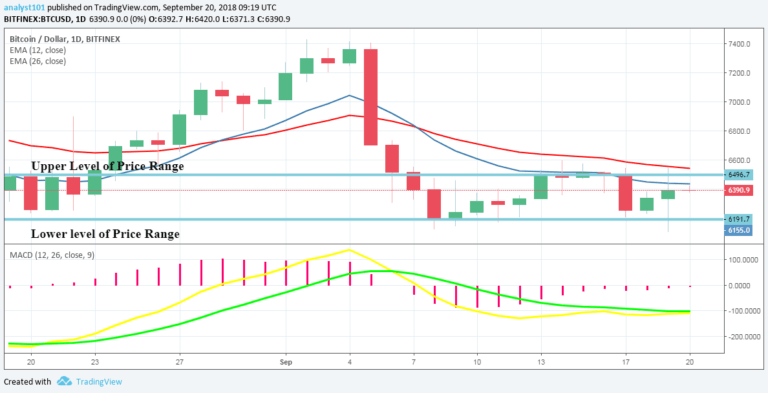
The price of Bitcoin was in a bullish trend yesterday. The bulls reached the upper level of $6,526.81 but were resisted at the upper level of the price range. Today, the BTC price has fallen and is ranging above the $6,300 price level. Today, the BTC price has fallen and is ranging above the $6,300 price level. This has been the scenario in the last few days. Bitcoin is facing serious selling pressure at $6.400.
If the bulls can hold the selling pressure at the support zone of $6075-$6,200, they can do so at the resistance level of $6,400-$6,900. More buyers are needed at the price of $6,400 for the bulls to push the price beyond the upper level of price range.
The MACD line and the signal line are below the zero line which indicates a sell signal. The price of Bitcoin is below the 12-day EMA and 26-day EMA which indicates that the price is falling.
BTCUSD Short-term Trend: Ranging

On the 4-hour chart, the BTC price is in a range bound movement. On September 19th, the BTC price reached the upper level of the price range and was repelled. Meanwhile, the Relative Strength Index period 14 is level 51 which indicates that the price is in the sideways trend zone.
The views and opinions expressed here do not reflect that of CryptoGlobe.com and do not constitute financial advice. Always do your own research.


