

BTCUSD Medium-term Trend: Ranging
Resistance levels: $6,500, $6,700, $6,900
Support levels: $6,200, $6,000, $5,800
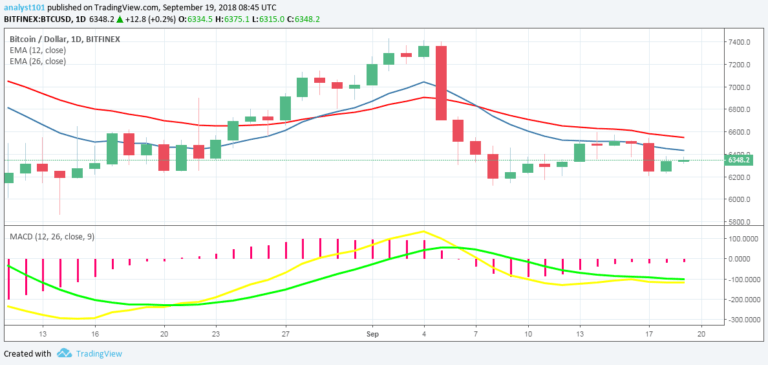
Bitcoin’s price was in a bullish trend yesterday. After a bearish trend tested the lower level of its current price range, which is $6,200, there were assumptions the price would eventually reach the support zone of $6,075-$5,900. However, yesterday BTC made a bullish movement to a previous high of $6,400 but faced resistance at $6,376.87. Today, the price of Bitcoin is fluctuating above the $6,300 level.
Both buyers and sellers are seemingly undecided on the direction the price will go. There are indicators pointing to an imminent breakout. Nevertheless, the MACD is in favor of the bears as the MACD and signal lines are below the zero line which is a sell signal .The price of Bitcoin is below the 12-day EMA and 26-day EMA which indicates the price is falling.
BTCUSD Short-term Trend: Ranging

On the 4-hour chart, the BTC price is in a range bound movement. It fell to a low of $6,211.45 and commenced the range bound movement at $6,300. Meanwhile, the Relative Strength Index period 14 is level 47 which indicates the price is in a sideways trend zone.
The views and opinions expressed here do not reflect that of CryptoGlobe.com and do not constitute financial advice. Always do your own research.


