

Bitcoin Price Medium-term Trend: Ranging
Resistance levels: $6,500, $6,700, $6,900
Support levels: $6,300, $6,100, $5,900
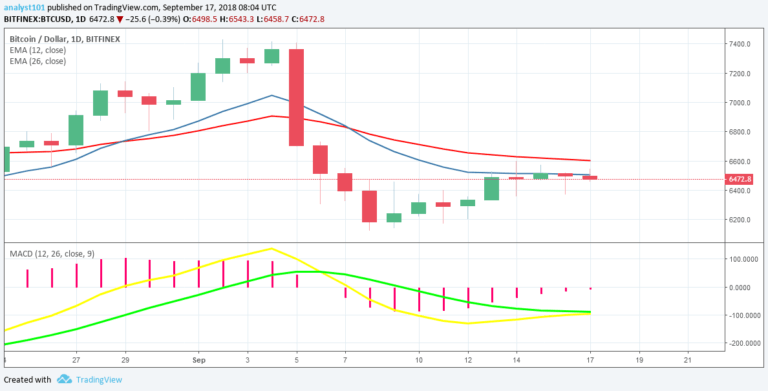
Last week the price of Bitcoin was in a range bound movement. On September 13, the cryptocurrency reached the high of $6,520 and commenced a ranged bound movement. The BTC price had been fluctuating above the $6,400 price level for the past five days.
A possible breakout is imminent because price has been consolidating above the $6,400 price level. However, the MACD indicator is in favor of the bears; as the MACD line and the signal line are below the zero line which indicates a sell signal. The price of Bitcoin is below the 12-day EMA and 26-day EMA which indicates that price is falling.
BTCUSD Short-term Trend: Ranging

On the 4-hour chart, the BTC price is range bound. On the lower time frame, the price of Bitcoin is range bound as the price was fluctuating horizontally above $6,400 price level. Meanwhile, the Relative Strength Index period 14 is level 51 which indicates that price is in a sideways trend zone.
The views and opinions expressed here do not reflect that of CryptoGlobe.com and do not constitute financial advice. Always do your own research.


