

BTCUSD Medium-term Trend: Bullish
Resistance levels: $6,500, $6,700, $6,900
Support levels: $6,200, $6,000, $5,800
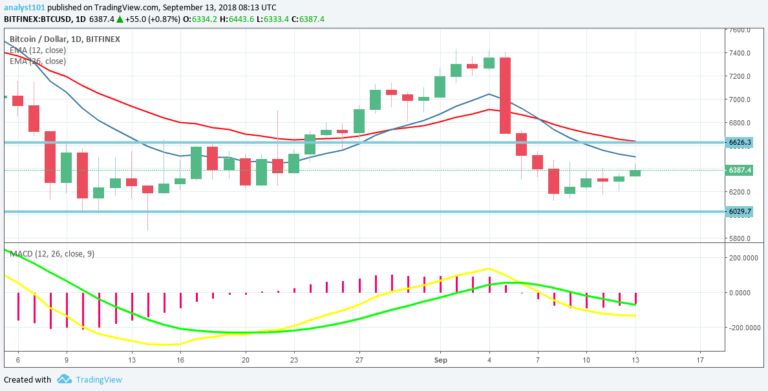
The price of Bitcoin was in a bullish trend yesterday. The cryptocurrency is currently fluctuating between the levels of $$6,200 and $6,400. Today, the BTC price reached the high of $6,450 but was overcome and repelled. Traders should exit their long trades and take in their partial profits.
Presently, the price of Bitcoin will likely fluctuate around the $6,400 price level. Meanwhile, the MACD line and the signal line are below the zero line which indicates a sell signal. The price of Bitcoin is below the 12-day EMA and 26-day EMA which indicates that the bearish trend is ongoing.
BTCUSD Short-term Trend: Bullish

On the 4-hour chart, the BTC price is in a bullish trend. The BTC price is below the 12-day EMA and 26-day EMA which indicates that the bullish trend is ongoing. Meanwhile, the Relative Strength Index period 14 is level 55 which indicates that the price is in a sideways trend zone.
The views and opinions expressed here do not reflect that of CryptoGlobe.com and do not constitute financial advice. Always do your own research.


