

Bitcoin Price Medium-term Trend: Bearish
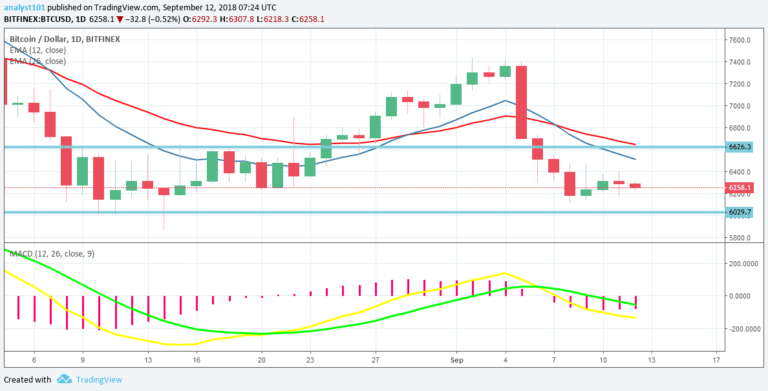
Resistance levels: $6,400, $6,600, $6,800
Support levels: $6,100, $5,900, $5,700
The BTCUSD pair was in a range bound movement. The bulls were facing selling pressure at the price of $6,400 while they are sustaining hold at the $6,200-$5,900 support zone.
Today, the price is making another move below the $6,200 price level. If the bears break this level, the critical support level which is $6,000 price level will be threatened. Meanwhile, the MACD line and the signal line are below the zero line which indicates a sell signal. The price of Bitcoin is below the 12-day EMA and 26-day EMA which indicates that the bearish trend is ongoing.
Bitcoin Price Short-term Trend: Ranging

On the 4-hour chart, the BTC price is range bound. The Relative Strength Index period 14 is level 38 which indicates the market is oversold suggesting bulls to take control of the market.
The views and opinions expressed here do not reflect that of CryptoGlobe.com and do not constitute financial advice. Always do your own


