

BTCUSD Medium-term Trend: Bearish
Resistance levels: $6,500, $6,700, $6,900
Support levels: $6,300, $6,100, $5,900
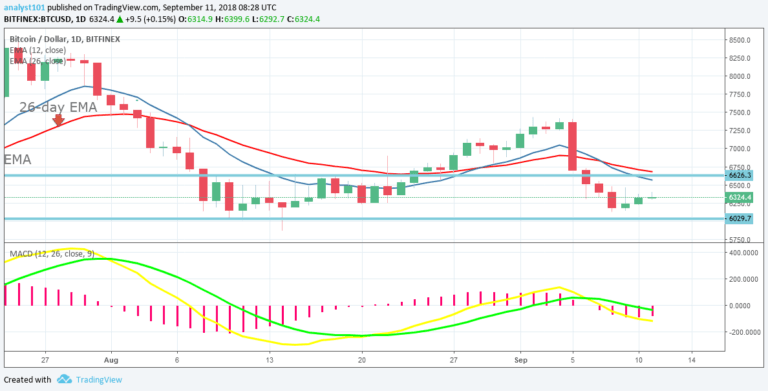
The price of Bitcoin was in a sideways trend. On September 5, the BTC price fell to the low of $6,294.72 but closed at $6,450.89. At the $6,400 price level, the bulls were facing more selling pressure. For the past seven days, the bulls have not been able to push through the price at $6,400. The price now fluctuates between the levels of $6,400 and $6,200.
The MACD line and the signal line are at par with the zero line which indicates a neutral signal. The price of Bitcoin is below the 12-day EMA and 26-day EMA which indicates that the overall trend is bearish.
BTCUSD Short-term Trend: Ranging

On the 4-hour chart, the BTC price is range bound. The chart explains that when a bearish candlestick reaches the low of $6,200 it will likely be resisted, then smaller candlesticks will stay in a range bound movement to the high of $6,400 and vice versa. Meanwhile, the Relative Strength Index period 14 is level 42 which indicates that price is in the range bound zone.
The views and opinions expressed here do not reflect that of CryptoGlobe.com and do not constitute financial advice. Always do your own research.


