

BTCUSD Medium-term Trend: Bearish
Resistance levels: $6,500, $6,700, $6,900
Support levels: $6,300, $6,100, $5,900
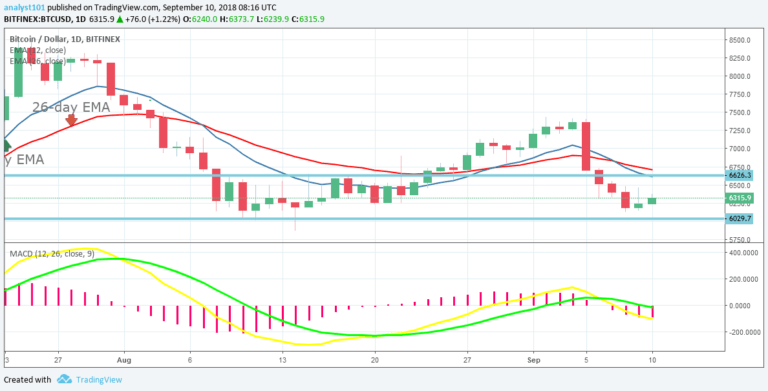
The BTCUSD pair was in a bearish trend last week, on September 5, the price of Bitcoin fell from the high of $7,391.86 to the low of $6,112.76. Bitcoin price fell into the previous range bound zone. The price has also tested the critical support level which is the $6,000 price level.
Today, the BTC price will revisit the upper level of the price range in order to break it. Traders ought to have initiated long trades when the price fell to the low of $6,112.76.
These long trades should be exited if the price fails to break the upper level of the price range. Meanwhile, the MACD line and the signal line are at par with the zero line which indicates a neutral signal. The price of Bitcoin is below the 12-day EMA and 26-day EMA which indicates that price was previous falling.
BTCUSD Short-term Trend: Ranging

On the 4-hour chart, the BTC price is range bound. The BTC price is in the range bound zone approaching the $6,300 price level. Meanwhile, the Relative Strength Index period 14 is level 42 which indicates that the price is in the range bound zone.
The views and opinions expressed here do not reflect that of CryptoGlobe.com and do not constitute financial advice. Always do your own research.


