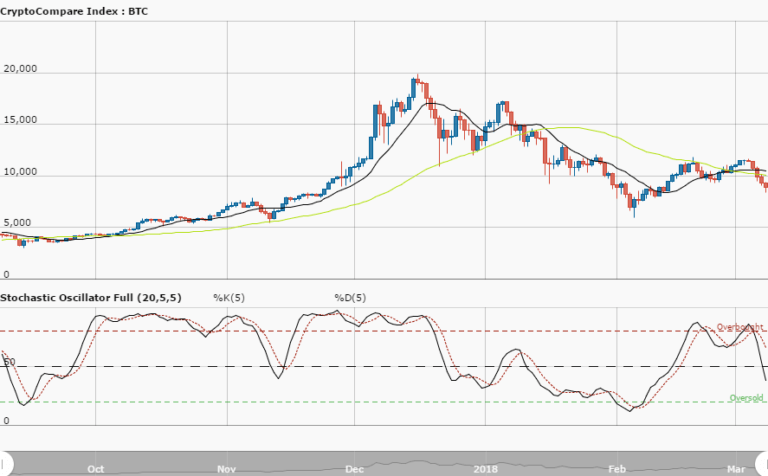
BTCUSD Long-term Trend – Bullish
Distribution territories: $7,500, $8,500, $9,500.
Accumulation territories: $6,000, $5,000, $4,000.
Bitcoin suffered a considerable downturn against the US dollar within the first and the second trading day sessions of this week. The downturn that occurred on September 17, in the market price value of the crypto was so visibly noted to the extent of touching the territory of $6,205 below the trend-line of the 14-day SMA.
On September 18, the crypto strived to make an upward move in its price line as on the following day, it witnessed a degree of erratic movements that led to pushing the price a bit beyond the last low price point of $6,205. But, the movements eventually went in favor of northward direction that also brought about the breakout of the 14-day SMA from below. Price has now been averaging the price territory of $6,800 below the trend-line of the 50-day SMA. The %0-day SMA is located over the 14-day SMA. The Stochastic Oscillators have crossed to point north a bit above range 20. This suggests that bullish market trend has a greater prevailing probability over the bears driving force. The price territory of $6115 has been observed as the low-testing area for the price of BTCUSD over a week as the first and the second low-price testing were achieved on September 8 and 19. The accumulation territory of $6,000 remains the critical price point that bears may not breach past easily as the current bullish movement could probably be extended past the territory of $6,800. The assertion is strongly built in the bullish bias. But, strong price action must be looked out for before placing a trade.
The views and opinions expressed here do not reflect that of CryptoGlobe.com and do not constitute financial advice. Always do your own research.


