

XRPUSD Medium-term Trend: Bearish
Supply levels: $0.39, $0.40, $0.41
Demand levels: $0.38, $0.37, $0.36
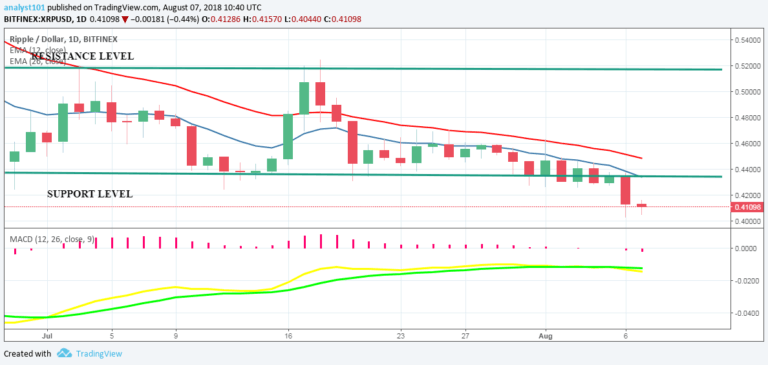
Yesterday, the XRP price was in a bearish trend. We saw how it broke the support level at $0.43 on three occasions and it pulled back on each occasion. We are waiting to see how the bears would break the level at $0.43 and sustain their bearish status. Today, the XRP price has finally broken the support level at $0.43 of the lower range-bound zone.
The price is likely to find support at the $0.37 and $0.32 lows, if the bearish pressure continues. Traders are advised to initiate long trades at the end of the bearish pressure. Nevertheless, the MACD line and the signal line are below the zero line which indicates a buy signal. Also, the XRP price is below the 12-day EMA and the 26-day EMA which indicates that the bearish pressure continues.
XRPUSD Short-term Trend: Bearish

The 4-hour chart shows that the XRP price is in a downward trend. The XRP price has broken the support at $0.43 and it’is reaching the $0.41 low. Meanwhile, the XRP price is below the 12-day EMA and the 26-day which indicates that the bearish trend is ongoing. Nevertheless, the Relative Strength Index period 14 is level 28 which indicates that the market is oversold suggesting that the bulls will take control of the market.
The views and opinions expressed here do not reflect that of CryptoGlobe.com and do not constitute financial advice. Always do your own research.


