
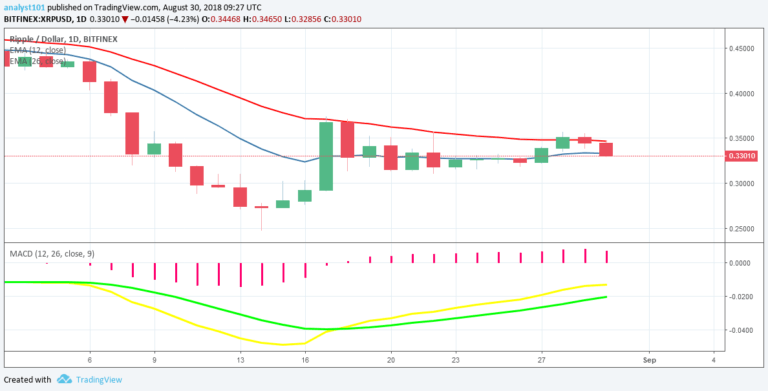

XRPUSD Medium-term Trend: Ranging
Supply levels: $0.35, $0.37, $ 0.38
Demand levels: $0.30, $0.28, $0.26
Yesterday, the XRPUSD pair was in a downward trend as the price was resisted at the $0.35 price level. Before the downward trend, the XRP price had twice tested the resistance level at $0.36 without a breakthrough. Today, the cryptocurrency is still in a downward trend as the price is approaching the low of $0.32. The XRP price had been range bound between the level s of $0.36 and $30 since August 14.
As the price is approaching the support level at $0.30, it might break that level or be resisted. If the bears break that level the cryptocurrency may find support at $0.25. On the other hand, if the price is resisted then traders should initiate long trades and stop-loss orders below the $0.30 price level. The MACD line and the signal line are below the zero line which indicates a sell signal.
The XRP price is below the 12-day EMA and the 26-day EMA which indicates that the price is falling.
XRPUSD Short-term Trend: Bearish

On the 4-hour chart, the XRP price is in a downward trend. The XRP price is falling and approaching the lower level of a price range. Nevertheless, the Relative Strength Index period 14 is level 43 which indicates that the market is nearing the bullish trend zone.
The views and opinions expressed here do not reflect that of CryptoGlobe.com and do not constitute financial advice. Always do your own research.


