

XRPUSD Medium-term Trend: Ranging
Supply levels: $0.40, $0.42, $ 0.44
Demand levels: $0.32, $0.30, $0.28
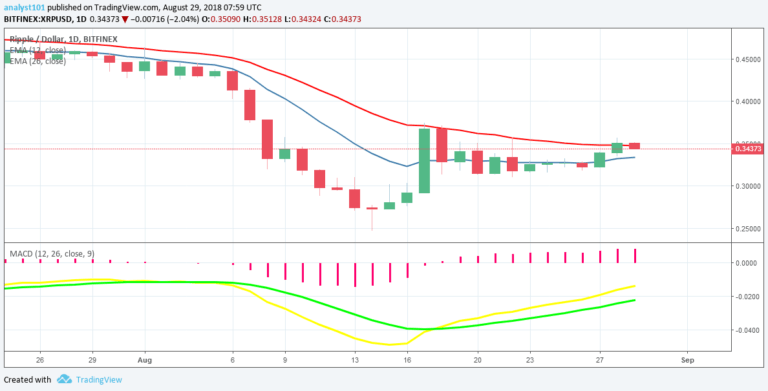
Yesterday, the XRPUSD pair was in a bullish trend. The XRP price made a bullish movement to the high of $0.34 but was unable to hold on to the price. As tje price fails to break the upper level of the range bound zone at $0.36, the cryptocurrency is likely to continue its range bound movement between the levels of $0.30 and $0.36.
If the price breaks the upper level of the range, XRP price will likely reach the previous high of $0.45. On the other hand, if the price breaks the lower level of the range, XRP will likely reach the previous low of $0.25.
Nevertheless, the MACD line and the signal line are below the zero line which indicates a sell signal. Also, the XRP price is below the 12-day EMA and the 26-day EMA which indicates that the XRP price is falling.
XRPUSD Short-term Trend: Ranging

On the 4-hour chart, the XRP price is in a downward trend. From the chart, the price fell from the high of $0.35 to the low of $ The Relative Strength Index period 14 is level 59 which indicates that the market is nearing the bullish trend zone.
The views and opinions expressed here do not reflect that of CryptoGlobe.com and do not constitute financial advice. Always do your own research.


