

XRP Price Medium-term Trend: Ranging
Supply levels: $0.35, $0.37, $ 0.39
Demand levels: $0.30, $0.28, $0.26
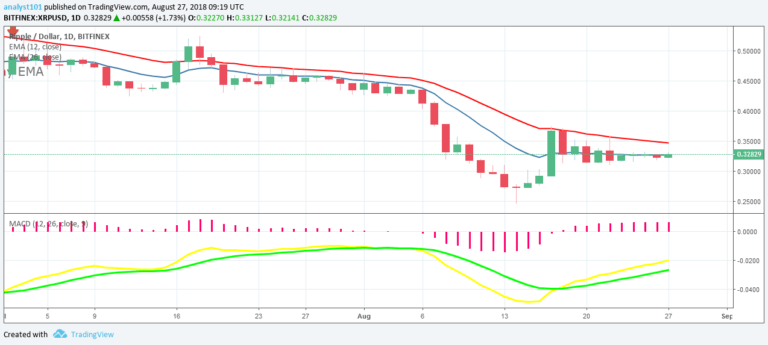
Last week the XRPUSD pair was range bound. The cryptocurrency fell to a low of $0.31 while in a bearish trend. It had been ranging horizontally at this price level throughout last week. Today, the cryptocurrency may not see any significant price movements. Rather, its price will likely fluctuate between $0.30 and $0.36 until a breakout occurs.
If the $0.30 price level holds, traders should look out for buy setups to go long. From the daily chart, the MACD and signal lines are below the zero line which indicates a sell signal. Similarly, the price of XRP is below the 12-day EMA and 26-day EMA which indicates a bearish trend is ongoing.
XRP Price Short-term Trend: Ranging

On the 4-hour chart, XRP is range bound. Its price is above the 12-day EMA and 26-day EMA which indicates that the price of the cryptocurrency is rising. Meanwhile, the Relative Strength Index period 14 is level 54 which indicates it is in a range-bound zone.
The views and opinions expressed here do not reflect that of CryptoGlobe.com and do not constitute financial advice. Always do your own research.


