

XRP Price Medium-term Trend: Bullish
Supply levels: $0.34, $0.35, $ 0.36
Demand levels: $0.30, $0.29, $0.28
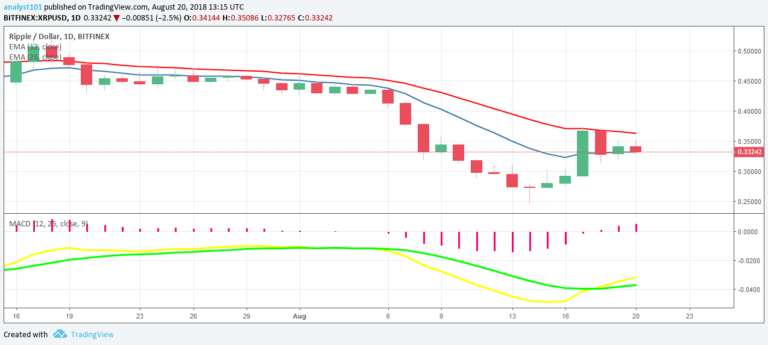
Last week the XRP price was in a bullish trend. The cryptocurrency fell to the low of $0.26 and made a bullish movement to the high of $0.37. With this bullish movement, the XRP price is now out of the previous range-bound zone. Today, the price is expected to rise as the bulls pull back from the low.
The price is now at the support level at $0.33. We have to wait to ensure price will hold at this level before initiating long orders. From the chart, the MACD line and the signal line are below the zero line which indicates a sell signal. Similarly, the price of XRP is below the 12-day EMA and 26-day EMA which indicates that a bearish trend is ongoing.
XRP Price Short-term Trend: Bullish

On the 4-hour chart, the XRP price is in a bullish trend. The price of XRP is above the 12-day EMA and 26-day EMA which indicates that the price is rising. Meanwhile, the Relative Strength Index period 14 is level 54 which indicates that the price is in the range-bound trend zone.
The views and opinions expressed here do not reflect that of CryptoGlobe.com and do not constitute financial advice. Always do your own research.


