
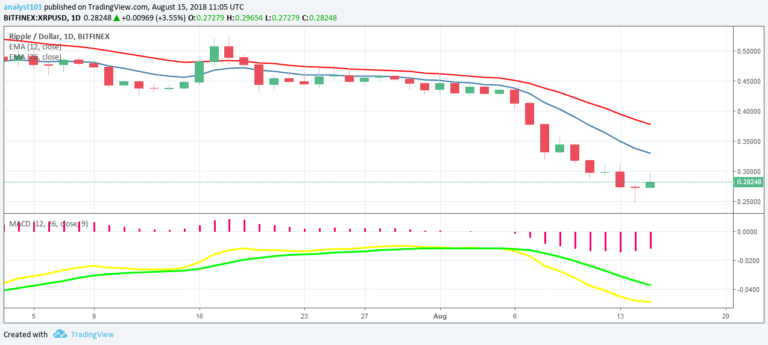

XRP Price Medium-term Trend: Bearish
Supply levels: $0.29, $0.30, $ 0.31
Demand levels: $0.25, $0.24, $0.23
The XRP price was in a bearish trend yesterday and price fell to the low of $0.26. Today, the cryptocurrency is in a bullish trend as price reaches the high of $0.28. There are indications that XRP price will fall to its major support level at $0.24. The bears will face little no opposition as the price approaches the major support level.
However, the overall trend is bearish, as MACD line and the signal line are below the zero line which indicates a sell signal. Also, the price of XRP is below the 12-day EMA and 26-day EMA which indicates that a bearish trend is ongoing.
XRP Price Short-term Trend: Bearish

On the 4-hour chart, the XRP price is in a bearish trend. On August 14, the price fell to its low at a price of $0.25 and commenced a bullish movement to the high of $0.28. Today, a bearish candlestick appears indicating that price is falling. If the downward trend continued the support levels would be breached.
Meanwhile, the Relative Strength Index period 14 is level 43 which indicates that price is in a range bound zone.
The views and opinions expressed here do not reflect that of CryptoGlobe.com and do not constitute financial advice. Always do your own research.


