
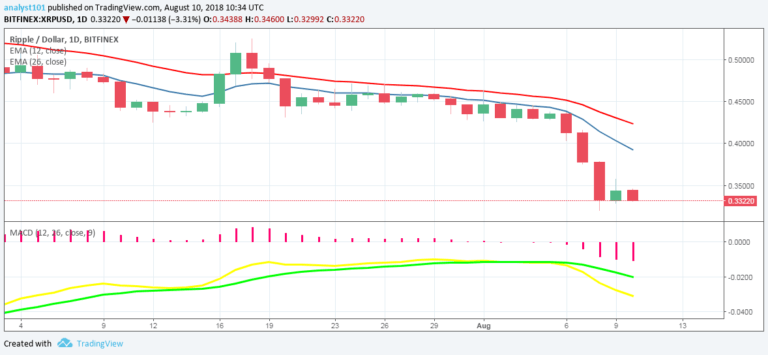

XRPUSD Medium-term Trend: Bearish
Supply levels: $0.35, $0.36, $ 0.37
Demand levels: $0.30, $0.29, $0.28
The XRP price was in a bearish trend yesterday. Yesterday it was suggested that if the bearish pressure continued the XRP price would fall from $0.32 to $0.23. The XRP price is currently trading at $0.33 as at the time of writing and is ranging between the levels of $0.32 and $0.34. As the market is oversold, the bull market should take over with more buyers to push the price upward.
Nevertheless, the MACD and moving averages are still showing a bearish outlook. The MACD line and the signal line are below the zero line which indicates a sell signal. Also, the XRP price is below the 12-day EMA and the 26-day EMA which indicates that the XRP price is falling.
XRPUSD Short-term Trend: Ranging

On the 4-hour chart, the XRP price is in a range-bound movement. From the chart, the bearish outlook is gradually changing to a range bound movement. Nevertheless, the Relative Strength Index period 14 is level 23 which indicates that the market is oversold suggesting bulls might take control of the market.
The views and opinions expressed here do not reflect that of CryptoGlobe.com and do not constitute financial advice. Always do your own research.


