
 Litecoin Chart by Trading View
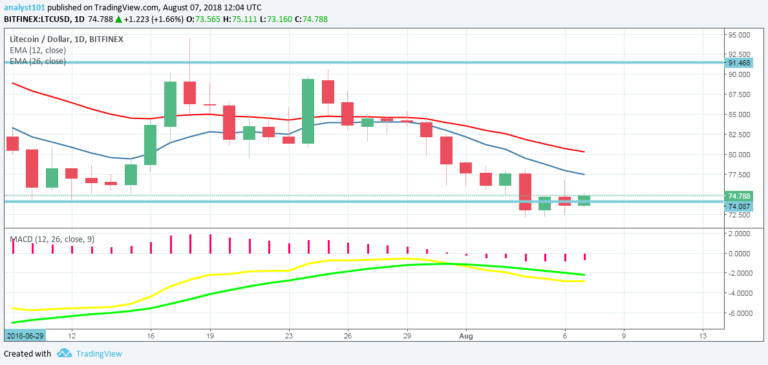
LTCUSD Medium-term Trend: Ranging
Resistance Levels: $75, $77, $79
Support Levels: $70, $72, $74
Yesterday, the price of Litecoin was in a bearish trend. However, after the bears broke the support level at $ 74, the price pulled back into the range-bound zone. Now we are waiting for a retest of the support level at $74 by the bears. From the daily chart, the LTC price retested the support at $74 but the bulls defended and pulled the price back into the range-bound zone.
The pirce of Litecoin is likely to fluctuate again within the range-bound zone. But if the bears succeed in breaking the support level at $74, the LTC price will find support at $ 52 or $57. Meanwhile, the MACD line and the signal line are below the zero line which indicates a sell signal. Also, the price of Litecoin is below the 12-day EMA and the 26-day EMA which indicates that the bearish trend is ongoing.
LTCUSD Short-term Trend: Bullish
 Litecoin Chart by Trading View
On the 4-hour chart, the LTC price broke the support level at $74 twice and had a pullback twice. Meanwhile, the Relative Strength Index period 14 is level 49 which indicates that the price of Litecoin is in the range-bound zone.
The views and opinions expressed here do not reflect that of CryptoGlobe.com and do not constitute financial advice. Always do your own research.


