
 Litecoin Chart by Trading View
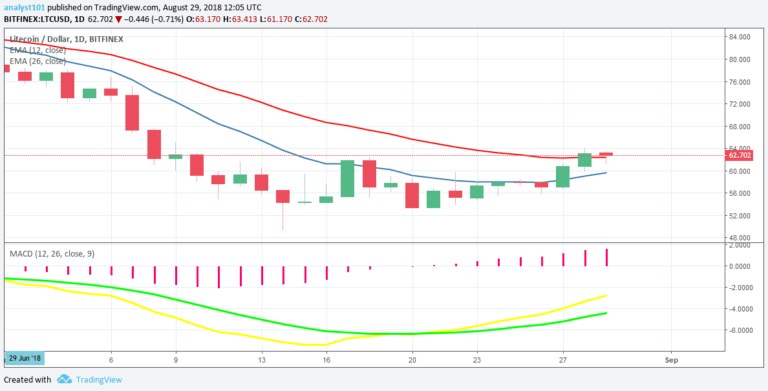
LTCUSD Medium-term Trend: Ranging
Resistance Levels: $70, $80, $90
Support Levels: $60, $50, $40
The LTCUSD pair was in a bullish trend. Today, the LTC price is in a bullish trend and the bulls have made another attempt to break the resistance at $62.
The bulls are already hovering around the price level. If the LTC price breaks that level, the cryptocurrency will reach the high of $75. However, if the bulls fail to break the $62 price level, the LTC price will fall back to the range bound zone. However, the MACD line and the signal line are below the zero line which indicates a sell signal.
Also, the price of Litecoin is below the 12-day EMA and the 26-day EMA which indicates that the bearish trend is ongoing.
LTCUSD Short-term Trend: Bullish
 Litecoin Chart by Trading View
On the 4-hour chart, the LTC price is in a bullish trend. The price of Litecoin is making the second attempt to break the $62 price level after the first attempt was unsuccessful. Meanwhile, the Relative Strength Index period 14 is level 41 which indicates that price is in the range bound zone.
The views and opinions expressed here do not reflect that of CryptoGlobe.com and do not constitute financial advice. Always do your own research.


