
 Litecoin Chart by Trading View
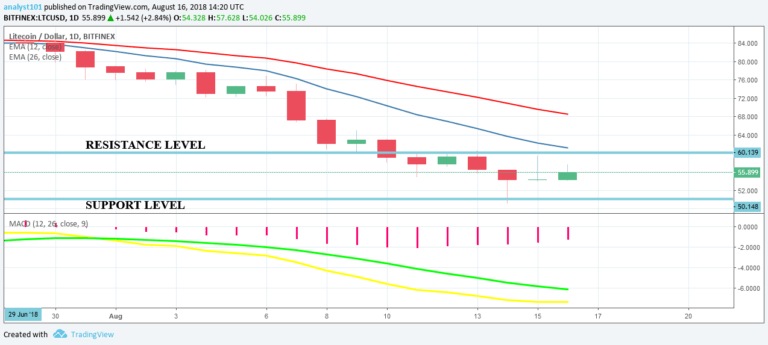
LTCUSD Medium-term Trend: Bearish
Resistance Levels: $56, $57, $58
Support Levels: $53, $52, $51
The LTC price was in a bullish trend. The cryptocurrency reached its previous high at $59.14 before the price pulled back to the low of $55.90. Today the price of Litecoin is in a range bound movement. On August 11th, since the market was oversold, the LTC price had been ranging between the levels of $60 and $50 .
Today, the LTC price will likely continue with its fluctuations between these levels. In the medium term, the MACD line and the signal line are below the zero line which indicates a sell signal. Also, the price of Litecoin is below the 12-day EMA and the 26-day EMA which indicates that the price is falling.
LTCUSD Short-term Trend: Ranging
 Litecoin Chart by Trading View
On the 4-hour chart, the LTC price is range-bound. In a ranging market, it is advisable to trade the support and resistance levels. That is, we trade only when the price gets to that level. For now, we suspend trading because the price is yet to get to the key levels. When trading begins one can place a short trade at the resistance level or a long trade at the support level.
Meanwhile, the Relative Strength Index period 14 is level 46 which indicates that the price is in the range bound trend zone.
The views and opinions expressed here do not reflect that of CryptoGlobe.com and do not constitute financial advice. Always do your own research.


