

Ethereum Price Medium-term Trend: Bearish
Supply zones: $550, $600, $650
Demand zones: $250, $200, $150
ETH is in a bearish trend in the medium-term outlook. $444.45 in the demand area of the lower price range of yesterday analysis was broken due to the strong bearish pressure. Price was further down to $422 in the demand area.
The flag formed as seen in the chart are signal for bears come back. Although bulls manage a push of price up to $437.21 in the supply area. The cryptocurrency was down to $410.97 as the bears returned.
The second flag is seen formed and it implies that the bears’ return is most probably in the medium-term.
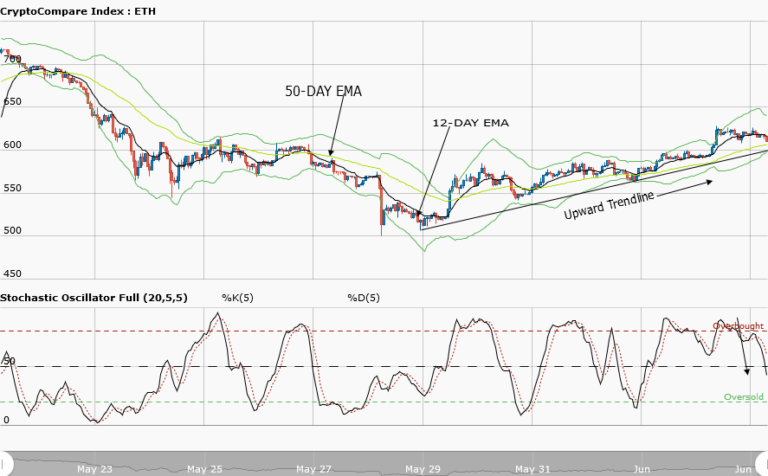
The stochastic oscillator is in the oversold region at 20% and it signal points down which implies downward momentum in price of the cryptocurrency.
$407 in the demand area may be bears target in the medium term as momentum increases.
Ethereum Price Short-term Trend: Bearish

ETH continues in a bearish trend in the short-term outlook. The strong bearish pressure drops the cryptocurrency at $427.40 in the demand area before the close of yesterday;s market which closes with spinning a top candle formation.
The daily opening candle was a bearish doji rejecting the upward movement and pushed price down to $410.97 with a large bearish engulfing candle.
The price is below the EMAs crossover and forming lower highs and lower lows that are bear market characteristics. The 12-day EMA is seen acting as strong resistance to the upward price movement.
The views and opinions expressed here do not reflect that of CryptoGlobe.com and do not constitute financial advice. Always do your own research.


