
ETHUSD Long-term Trend – Bearish
Distribution territories: $600, $650, $700.
Accumulation territories: $200, $150, $100.
Ethereum has been experiencing depreciation against the US dollar this week. The cryptocurrency kept declining until Aug. 15, at which point it started correcting upwards. A strong considerable spike occurred on Aug. 17.

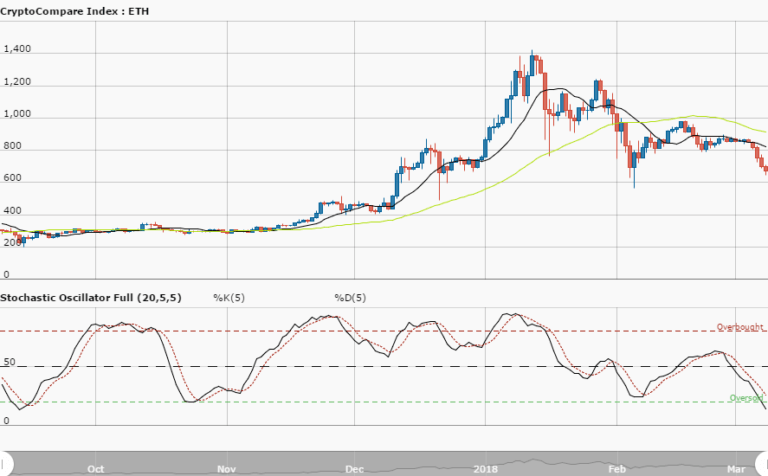
On the following day, its price was pushed down to the bottom price line of the preceding day. Currently, ETH is still trading below the trend-lines of both SMAs. The two SMAs have been separated by a large gap, with the 50-day SMA being above the 14-day SMA.
The Stochastic Oscillators have crossed into oversold zone to touch range 20 and are pointing north. This means a bullish trend may come sooner than expected. The accumulation territory of $250 has served as the strong support that the bears have been unable to breach, but managed to test.
The northward crossing of the Stochastic Oscillators means the bulls could take over the market from the bears’ forces. Traders may join upward movements.
The views and opinions expressed here do not reflect that of CryptoGlobe.com and do not constitute financial advice. Always do your own research.


