
EOSUSD Long-term Trend – Ranging
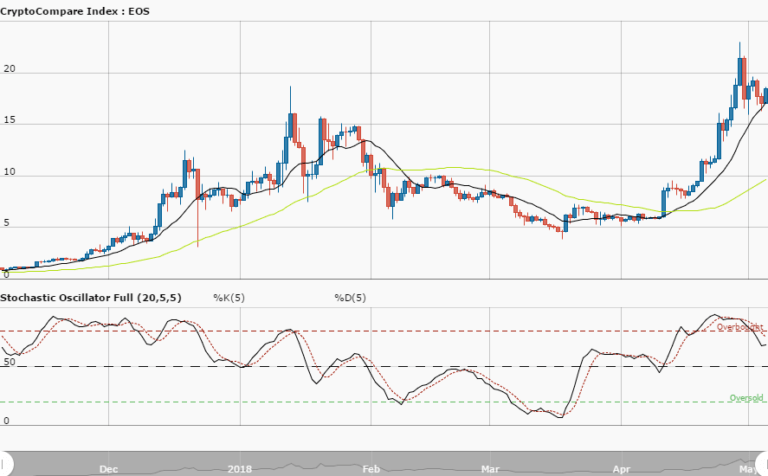
Distribution territories: $15, $20, $25.
Accumulation territories: $6, $4, $2.
On the second and the third trading days of this week the market moved against EOS. On July 1, the crypto resumed another set of ranging movements southward. Its price has now been pushed to hover around the last lowest point it hit, between July 12 and 15.

The immediate accumulation territory of $6 remains a critical line that has been difficult for the bears to touch or break. Today, August 5, EOS’ price has been seen maintaining the same trading pattern it had in the past few days, below the two SMAs. Notably, the 50-day SMA is still located above the 14-day SMA.
The Stochastic Oscillators have moved a bit past range 20. This means traders should proceed with caution when trading EOS. The cryptocurrency may have been slightly driven southbound primarily to build another series of lower highs and lower lows towards and around the immediate accumulation territory of $6.
The bulls will have to find a way to convincingly push the price past the distribution territory of $10 to confirm a bullish trend. Meanwhile, investors may come in, and traders may join the presumed upward movements with proper financial management rules.
The views and opinions expressed here do not reflect that of CryptoGlobe.com and do not constitute financial advice. Always do your own research.


