
BTCUSD Long-term Trend – Ranging
Distribution territories: $8,500, $9,500, $10,500.
Accumulation territories: $5,500, $4,500, $3,500.
This week, the BTCUSD pair has seen almost even lower highs and lower lows in its price. Notably, bitcoin suddenly experience a spike in its price, which helped it push past the distribution territory of $6,800 and touch its 50-day SMA on Aug. 22.

Soon after, the cryptocurrency declined towards the accumulation territory of $6,300. Its price has been hovering between the distribution territory of $7,000 and $6,200 in the past couple of days. The 14-day SMA has been briefly passed at $6,400, and currently has northbound bent. The 50-day SMA is clearly located above both the 14-day SMA and the price line at $6,800.
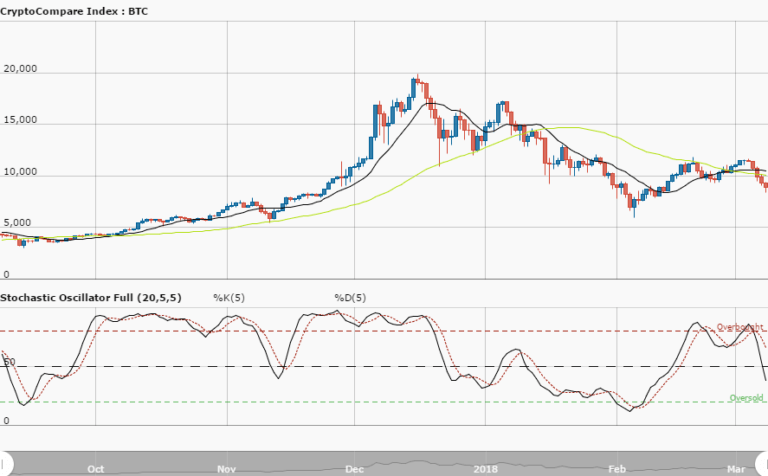
The Stochastic Oscillators have moved past range 20 to touch range 40 from below. The current ranging movements have been well-defined as they have been between the distribution and accumulation territories of $7,000 and $6,000, and this may soon come to an end. Both the bears and the bulls have the potential of taking the upper hand before the previously mentioned territories aren’t convincingly breached. Traders may enter positions when that occurs.
The views and opinions expressed here do not reflect that of CryptoGlobe.com and do not constitute financial advice. Always do your own research.


