

BTCUSD Medium-term Trend: Bearish
Resistance levels: $6,300, $6,400, $6,500
Support levels: $6,400, $6,300, $6,200
Yesterday, August 8th, the BTCUSD pair was in a bearish trend. In the bearish trend, the cryptocurrency fell to the low of $6,271.20 as of yesterday. It was also assumed that the price of Bitcoin may likely reach the low of $6,000 because it was the previous support level.
Today, the BTC price is approaching the support level of $6,000.
A blue horizontal line had been drawn at the support level of $6,000 to indicate that it had not been broken by the bears since November 13, 2017. This makes it a critical level and if eventually broken the breakout becomes powerful. My assumption is that the bulls are likely to defend the support level at $6,000.
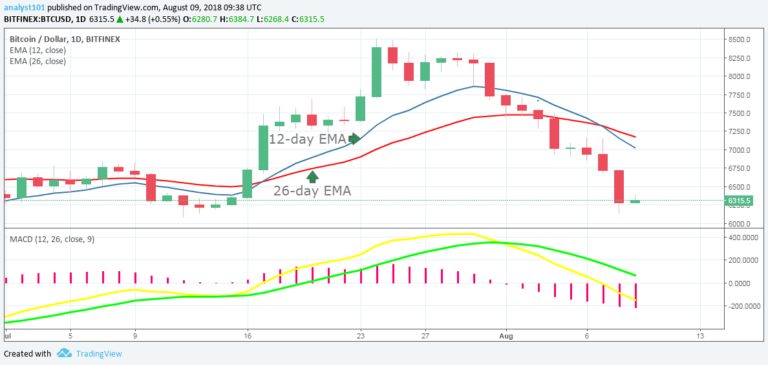
The MACD line and the signal line are above the zero line which indicates a buy signal. In addition, the price of Bitcoin is below the 12-day EMA and the 26-day EMA which indicates that the BTC price was falling.
BTCUSD Short-term Trend: Bearish

From the 4-hour chart, the BTC price is making a series of lower highs and lower lows. Meanwhile, the Relative Strength Index period 14 is level 23 which indicates that the market is oversold suggesting bulls might take control of the market.
The views and opinions expressed here do not reflect that of CryptoGlobe.com and do not constitute financial advice. Always do your own research.


