

Bitcoin Price Medium-term Trend: Bearish
Resistance levels: $7,000, $7,100, $7,200
Support levels: $6,800, $6,700, $6,600
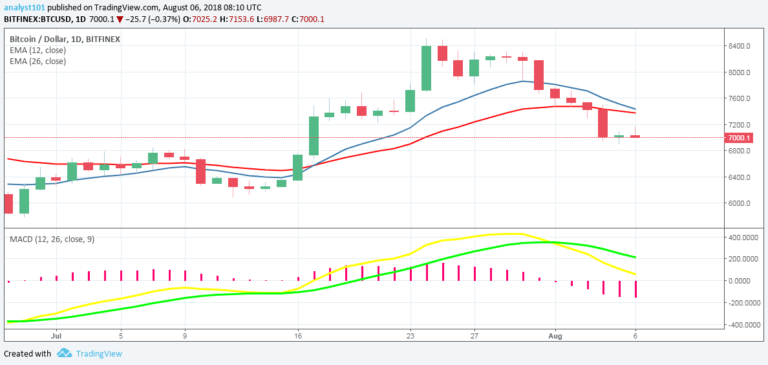
The price of Bitcoin had been in a downward trend since last week after its failure to break the resistance level at $8,400. Today, if the BTC price breaks the $7,048.63 price level, the price of Bitcoin will likely find support at either $6,500 or $6,000.
If the bears hold on at that price level, BTC price will commence a range bound movement. However, the MACD line and the signal line are above the zero line which indicates a buy signal. But the price bars of Bitcoin are below the 12-day EMA and the 26-day EMA which indicate that the bearish trend is ongoing.
BTCUSD Short-term Trend: Bearish

On the 4-hour chart, the price of Bitcoin is making a series of lower highs and lower lows. On August 4th, the BTC price was on a range bound movement after the bearish trend and price is likely to fall as per the moving averages.The Relative Strength Index Period 14 is level 32 which indicates that the market is oversold suggesting bulls to take control of the market.
The views and opinions expressed here do not reflect that of CryptoGlobe.com and do not constitute financial advice. Always do your own research.


