

Bitcoin (BTC) Price Analysis – August 31
BTCUSD Medium-term Trend: Bullish
Resistance levels: $7,100, $7,300, $7,500
Support levels: $6,900, $6 ,700, $6,500
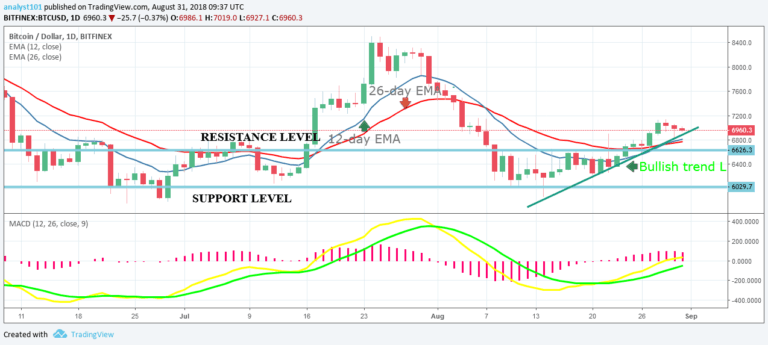
Yesterday, the price of Bitcoin was in a downward trend after the bulls lost hold of the $7,000 price level Later, the cryptocurrency retraced to the low of $6823.48 which was the support level of the bullish trend line. In my last analysis, I suggested that if the BTC price tested the bullish trend line traders should initiate long trades.
I am expecting a bullish green candlestick to test the trend line. This will propel the price higher. Another implication is that the BTC price will resume its bullish trend. The price is expected to eventually reach the high of $8,500 but may face resistance at the $8000 price level. Meanwhile, the MACD line and the signal line are above the zero line which indicates a buy signal.
Also, the price of Bitcoin is above the 12-day EMA and the 26-day EMA which indicates that the price is in a bullish trend.
BTCUSD Short-term Trend: Bullish

On the 4-hour chart, the BTC price is in a bullish trend. The price of Bitcoin made a bullish movement on the trend line and it is retracing for another attempt. Meanwhile, the Relative Strength Index period 14 is level 54 which indicates that the price is in the sideways trend zone.
The views and opinions expressed here do not reflect that of CryptoGlobe.com and do not constitute financial advice. Always do your own research.


