

Bitcoin Price Medium-term Trend: Bearish
Resistance levels: $7,400, $7,500, $7,600
Support levels: $7,200, $7,300, $7,400
Yesterday, August 2, the price of Bitcoin entered the third day of its bearish pressure. The cryptocurrency’s price was at $7,324.63 at the end of the day. It was assumed that if it broke the support level at $7,400, the cryptocurrency would find support at $7,200. However, since the $7,400 was broken the price may depreciate again.
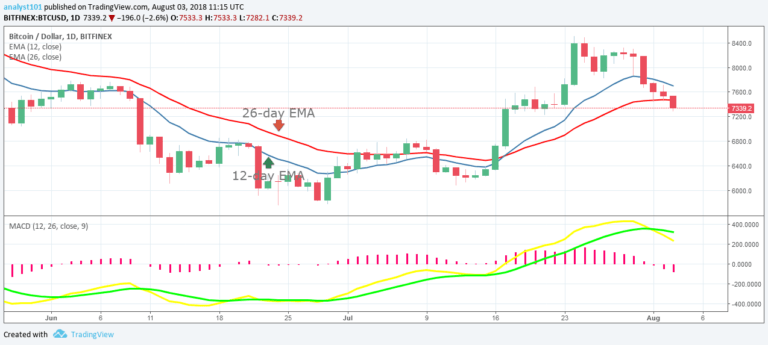
Bitcoin may fall to lows at $7,200 and $7,000. Meanwhile, the MACD and signal lines are above the zero line which indicates a buy signal for BTC. The cryptocurrency’s price is below the 12-day EMA and the 26-day EMA which indicates the bearish trend is ongoing.
Bitcoin Price Short-term Trend: Bearish

On the 4-hour chart, Bitcoin is in a bearish trend. From the chart, its price fell to a low of $7,348.50, after a range bound movement. Meanwhile, the Relative Strength Index period 14 is level 26 which indicates that the market is oversold, suggesting bulls may take control.
The views and opinions expressed here do not reflect that of CryptoGlobe.com and do not constitute financial advice. Always do your own research.


