

BTCUSD Medium-term Trend: Bullish
Resistance levels: $7,000, $7,200, $7,400
Support levels: $6,800, $6,600, $6,400
Yesterday, the BTCUSD pair was in a sideways trend. Today, the cryptocurrency is in a bullish trend and the BTC price is currently at a price of $7,024.70 as at the time of writing.
If the bulls eventually break the $7,000 price level, the cryptocurrency will be stronger and will likely pick up momentum to reach the high of $8,500. However, if the bulls fail to sustain the $7,000 price level the BTC price will fall and commence a range bound movement. In the same vein, traders are to exit their long trades and wait for the direction of the market.
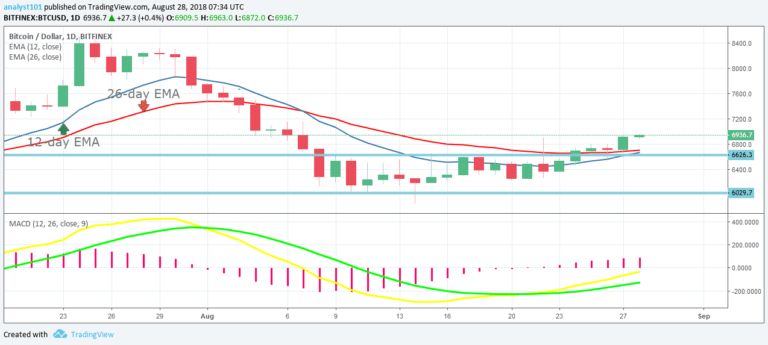
Meanwhile, the MACD line and the signal line are above the zero line which indicates a buy signal. Also, the price of Bitcoin is above the 12-day EMA and the 26-day EMA which indicates that a price is in a bullish trend.
BTCUSD Short-term Trend: Bullish

On the 4-hour chart, the BTC price is in a bullish trend. The price of Bitcoin is still making a series of higher highs and higher lows. Meanwhile, the Relative Strength Index period 14 is level 69 which indicates that price is in the bullish trend zone.
The views and opinions expressed here do not reflect that of CryptoGlobe.com and do not constitute financial advice. Always do your own research.


