

BTCUSD Medium-term Trend: Ranging
Resistance levels: $6,800, $7,000, $7,200
Support levels: $6,500, $6,300, $6,100
Last week the BTCUSD pair was in a sideways trend. On August 22, the upper level of the range was broken at $6,880.72. Later, the bears pulled back the price to a low of $6,303.65. Traders should know that it’s possible to buy low and sell high in a bullish or ranging market. On August 24, the bulls broke the zone’s upper level again, and the price of bitcoin is now ranging above the upper level of the zone.
BTC’s price is approaching the $7,000 level and will probably break through it. If it does, it’ll likely reach $7,500 and $8,000. On the other hand, if the price fails to break the $7,000 level, all long positions should be closed. Traders should then wait to buy again at a low for the cryptocurrency.
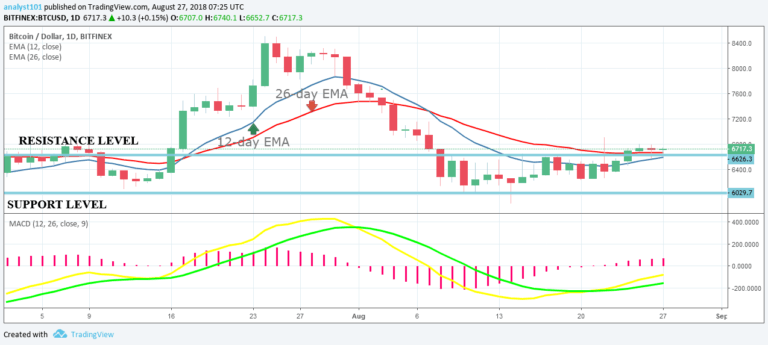
In addition, the MACD and signal lines are below the zero line which indicates a sell signal. Bitcoin’s price is above the 12-day EMA and the 26-day EMA which indicates the cryptocurrency is in a bullish trend zone.
BTCUSD Short-term Trend: Bullish
 Bitcoin Chart by Trading View
On the 4-hour chart, BTC is in a bullish trend. Its price is making a series of higher highs and higher lows. Meanwhile, the Relative Strength Index period 14 is level 58 which indicates the price is entering a bullish trend zone.
The views and opinions expressed here do not reflect that of CryptoGlobe.com and do not constitute financial advice. Always do your own research.


