

BTCUSD Medium-term Trend: Ranging
Resistance levels: $6,600, $6,700, $6,800
Support levels: $6,400, $6,300, $6,200
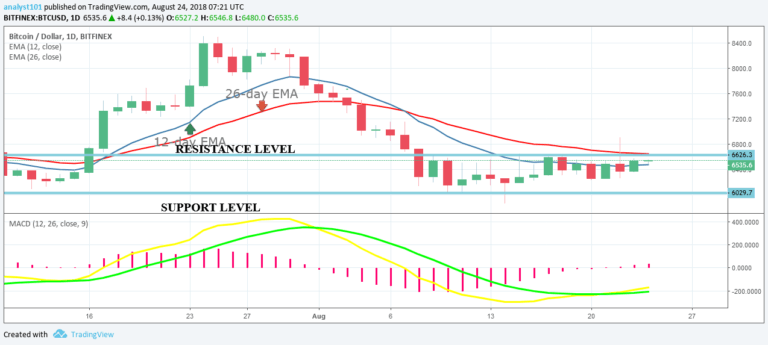
Yesterday, the price of Bitcoin fell into the range-bound levels of $6,600 and $6,000 after its inability to hold on to the higher level of price. Today, the price of Bitcoin is approaching the critical level of $6,600. If the bulls break the resistance level and hold on to price, the cryptocurrency will likely reach the highs of $7,000 and $7,500.
On the other hand, if the bulls face resistance, traders may wish to take short positions in anticipation of a downward fall. These positions should be exited as soon as price reached its previous low.From the chart, the MACD line and the signal line are below the zero line which indicates a sell signal.
Also, the price of Bitcoin is below the 12-day EMA and the 26-day EMA which indicates that a price was previous falling.
BTCUSD Short-term Trend: Ranging

On the 4-hour chart, the BTC price is range bound. The price of bitcoin is trending and approaching the $6,600 price level. The price of bitcoin is above the exponential moving averages indicating that price is rising. Meanwhile, the Relative Strength Index period 14 is level 55 which indicates that price is in the range bound zone.
The views and opinions expressed here do not reflect that of CryptoGlobe.com and do not constitute financial advice. Always do your own research.


